Features · 03 Monitor
Every connection. In view.
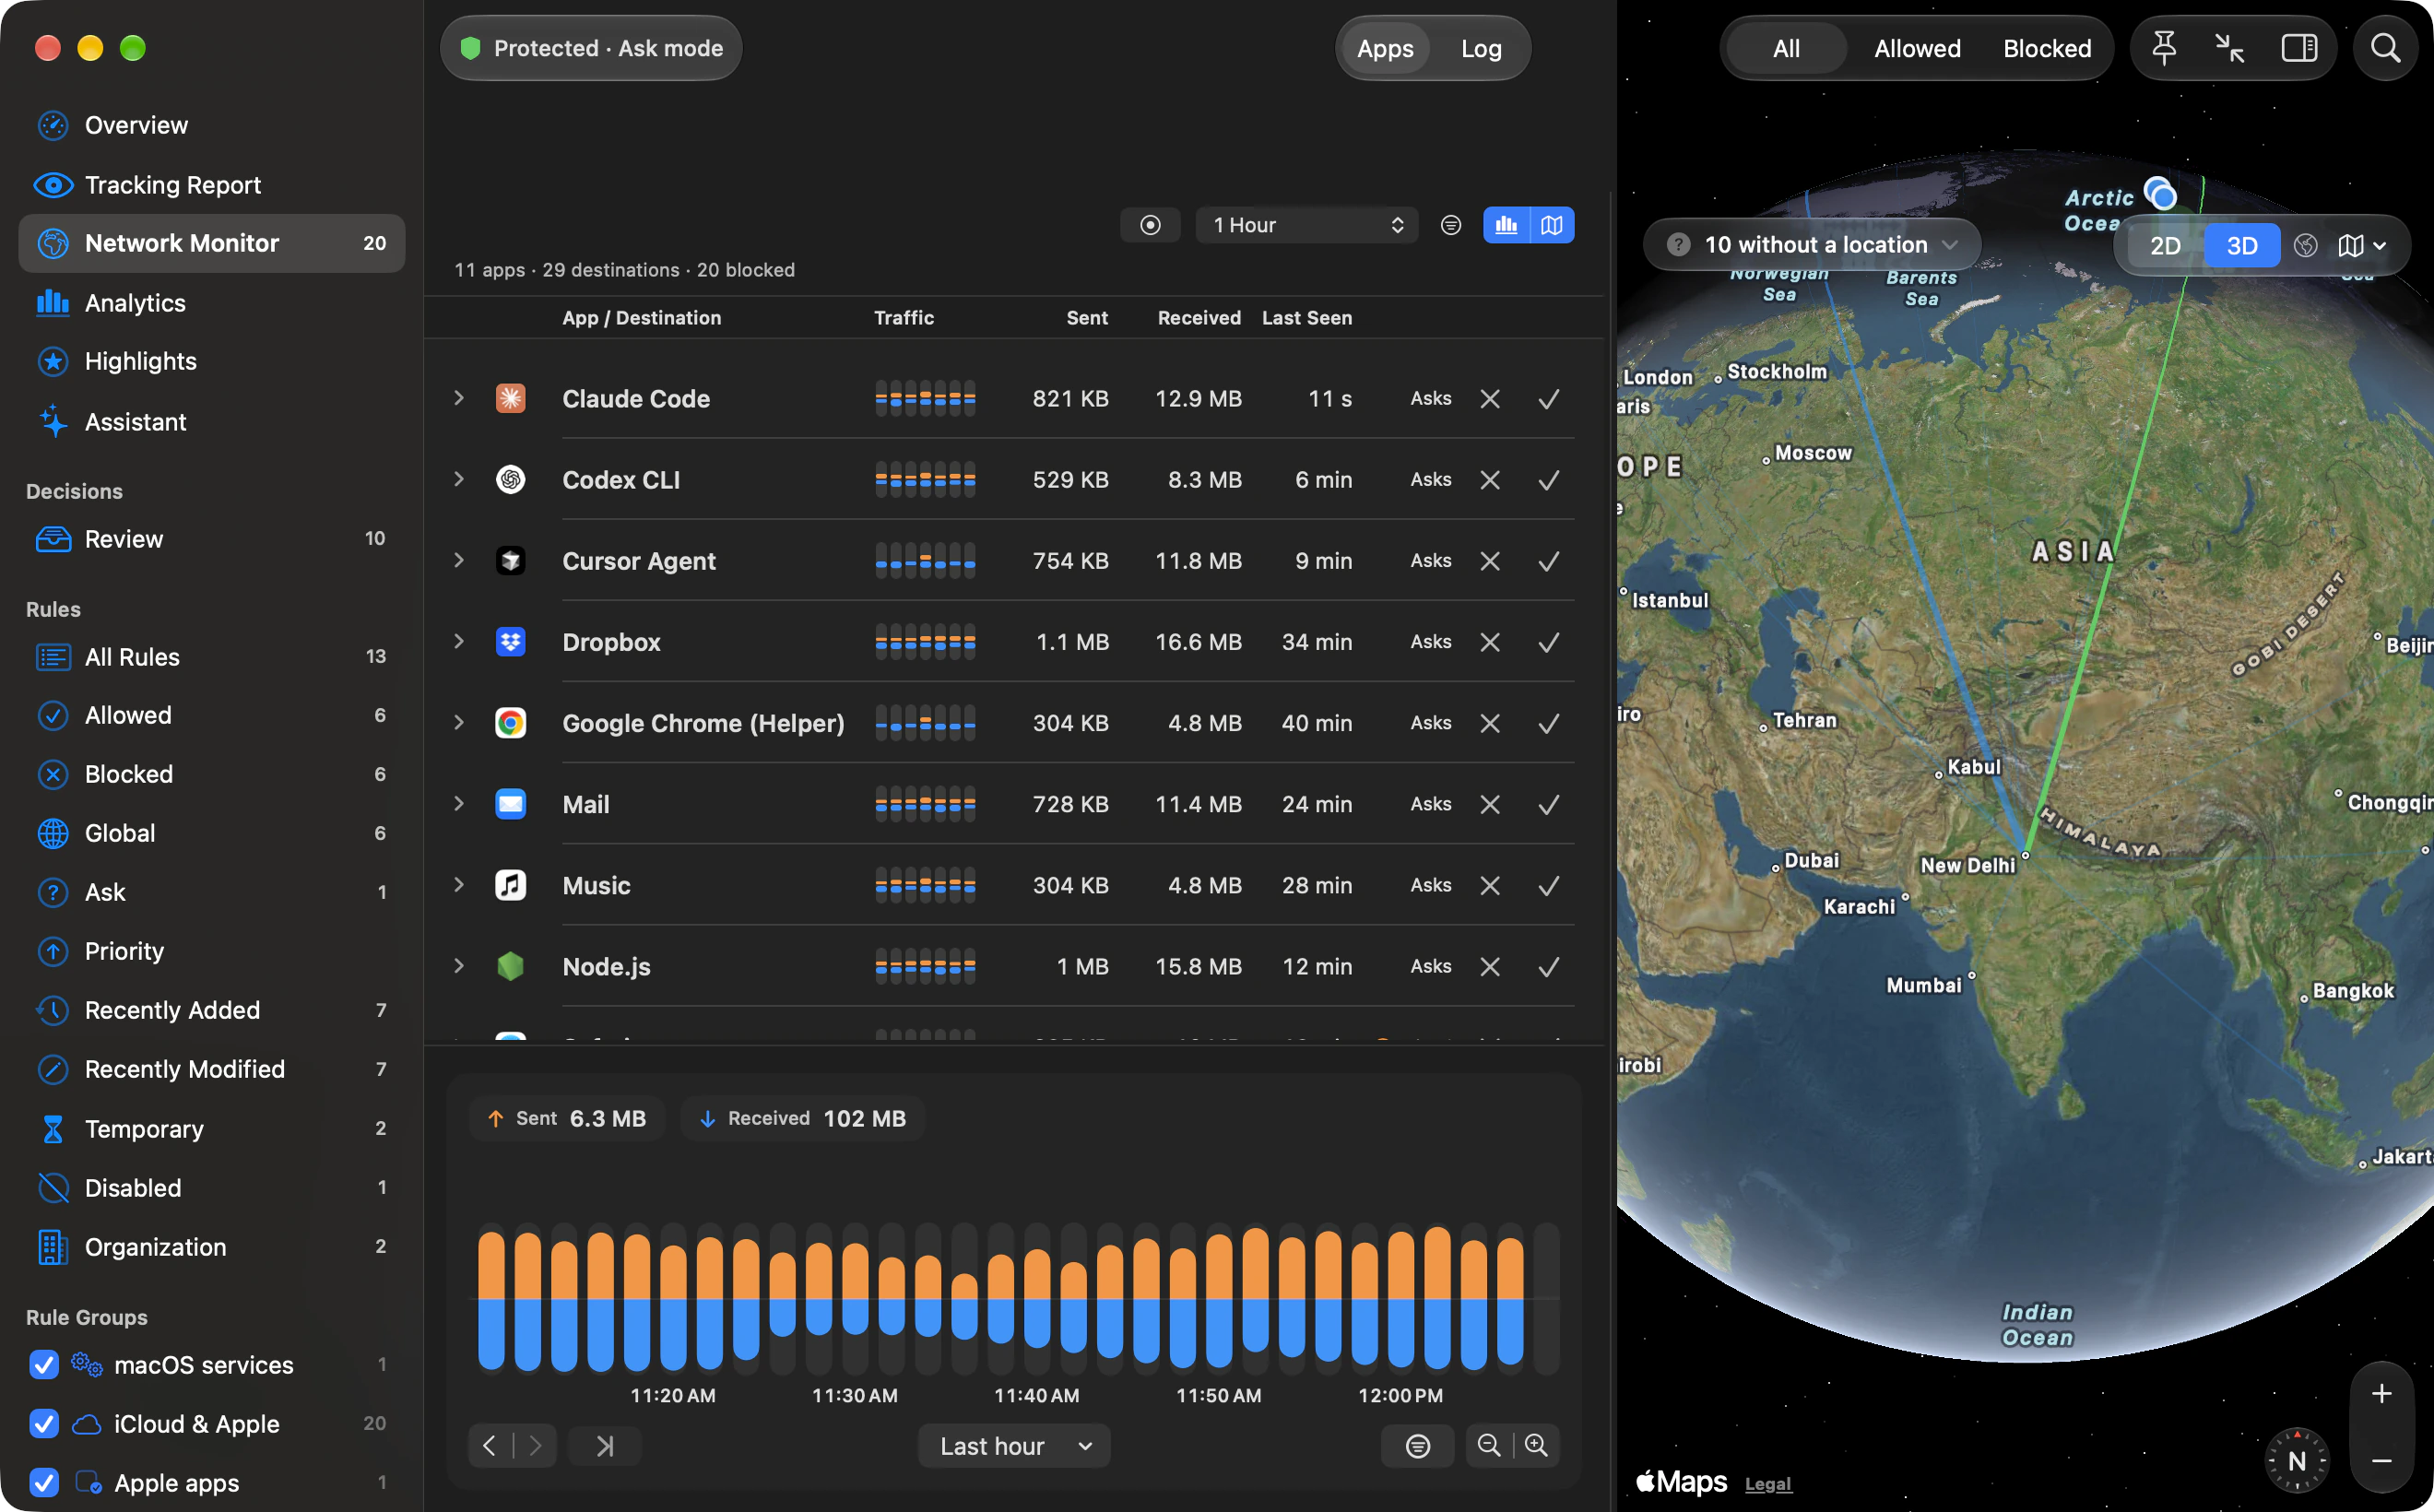
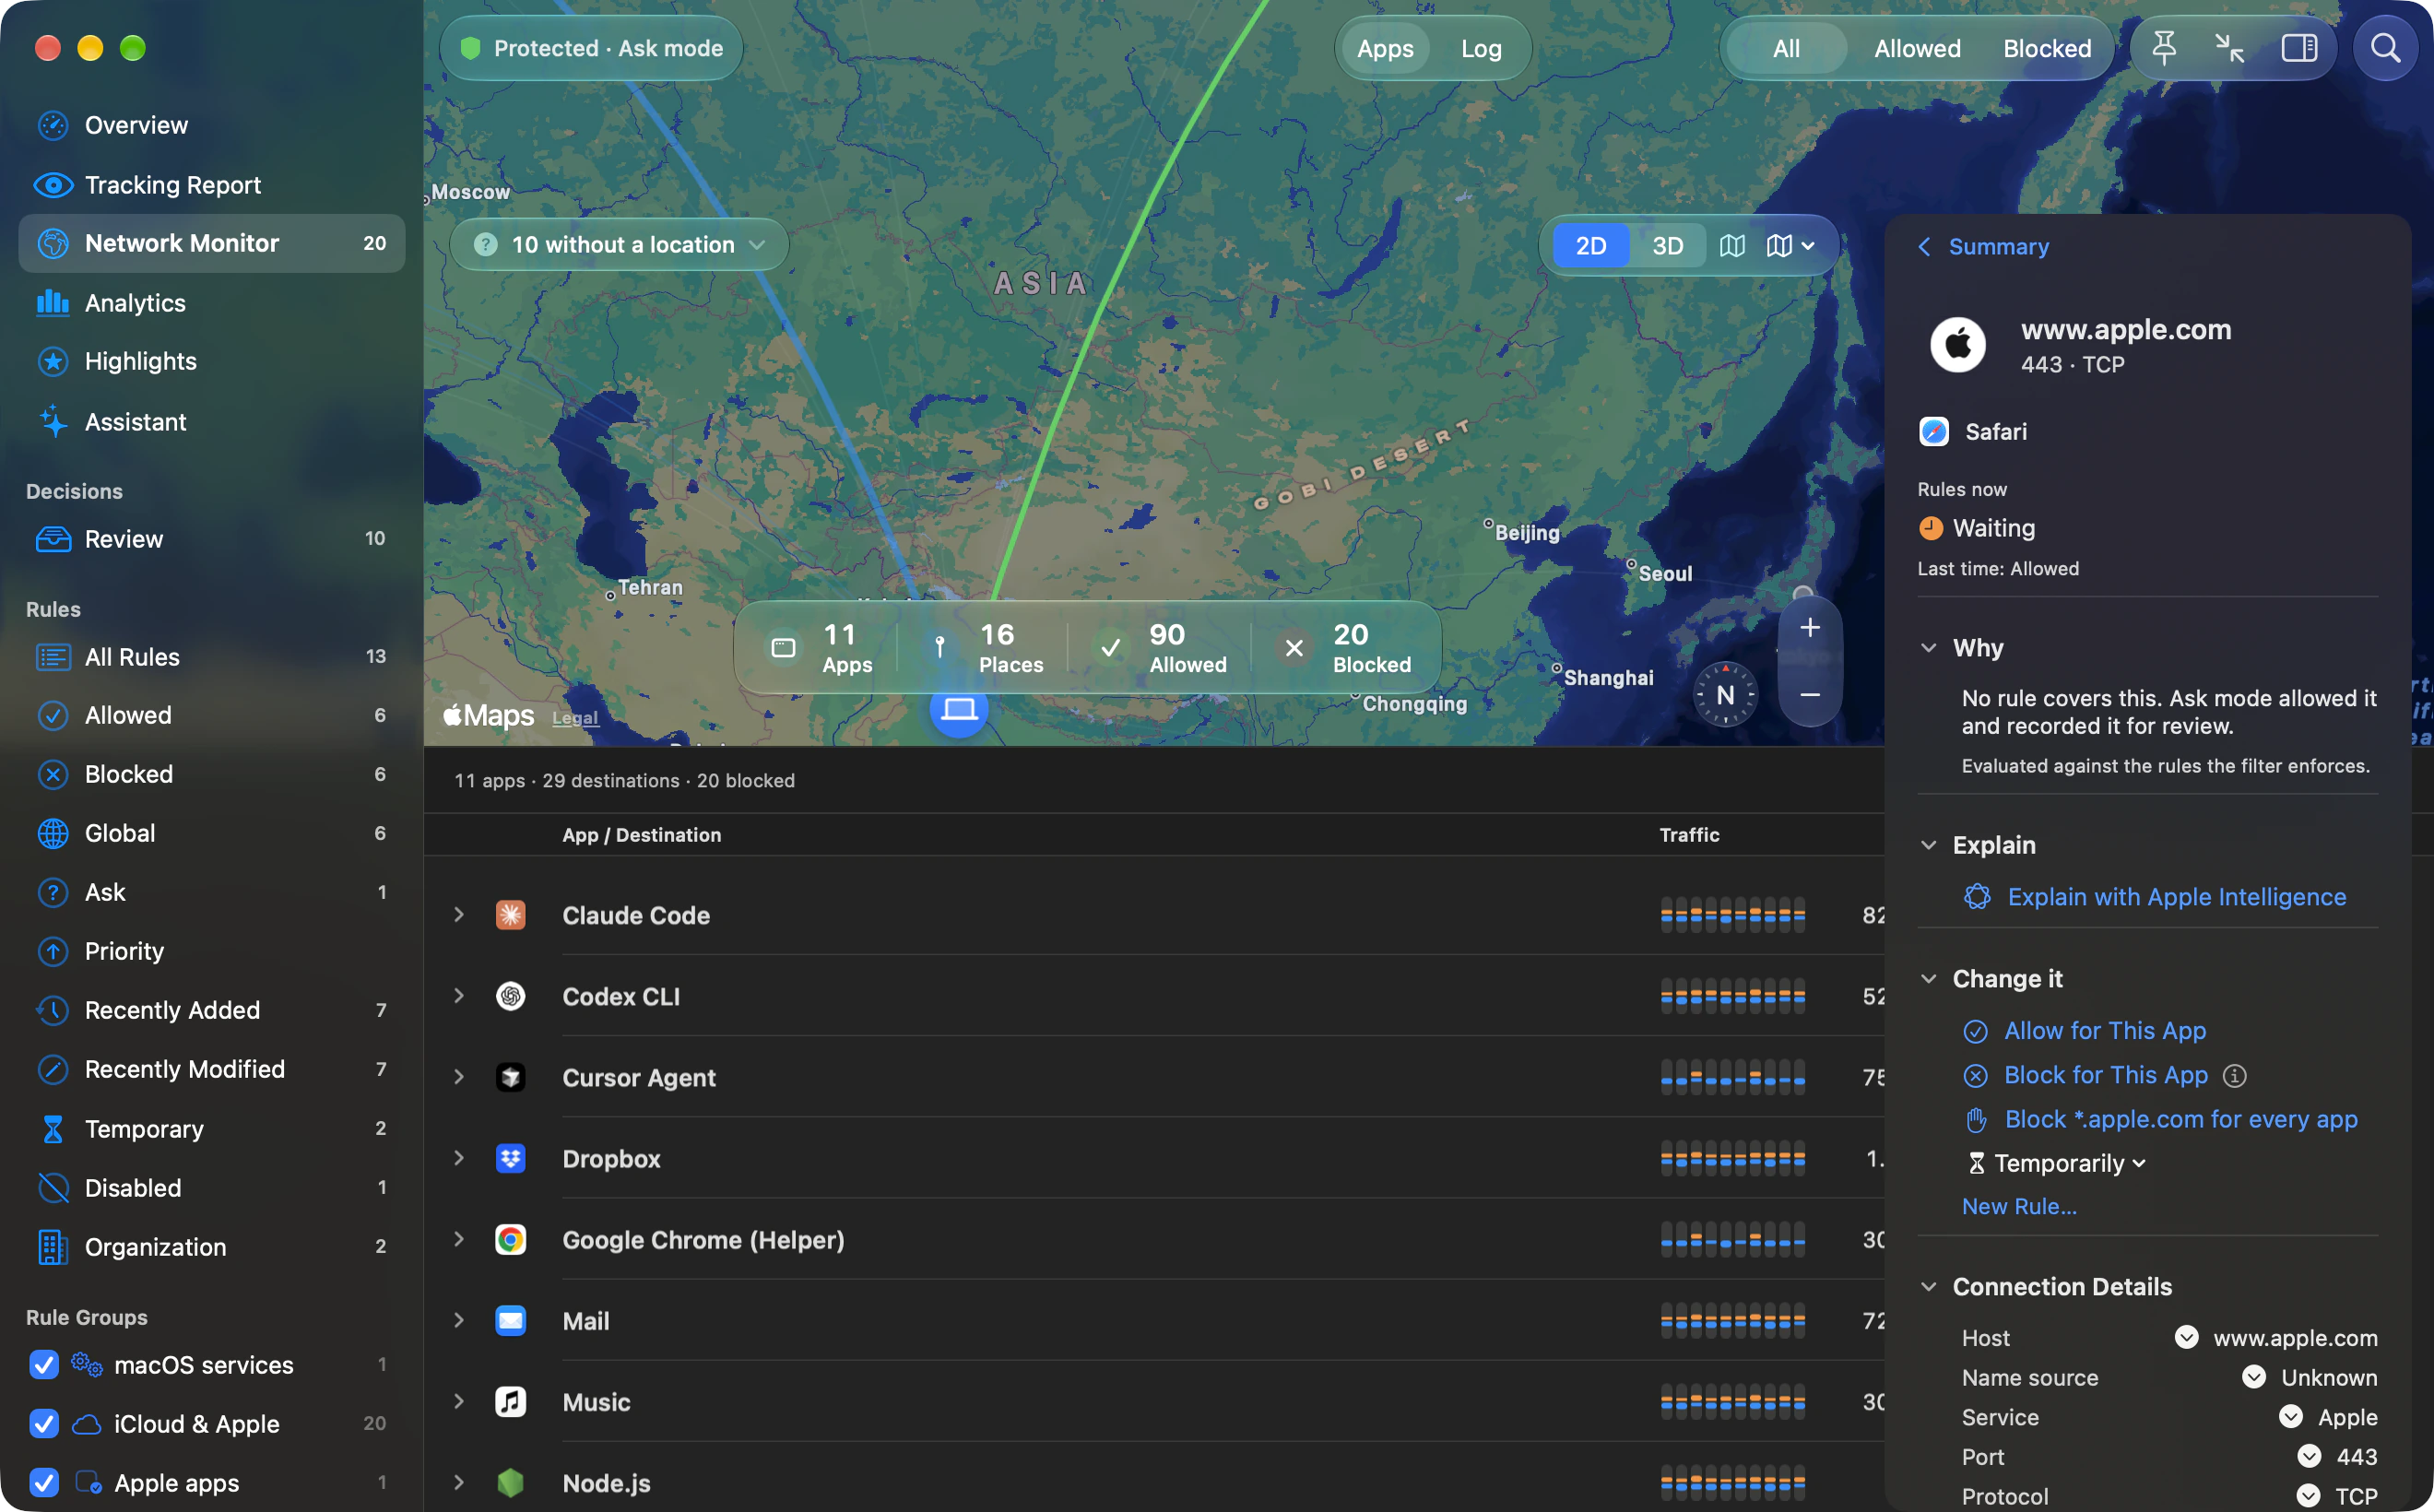
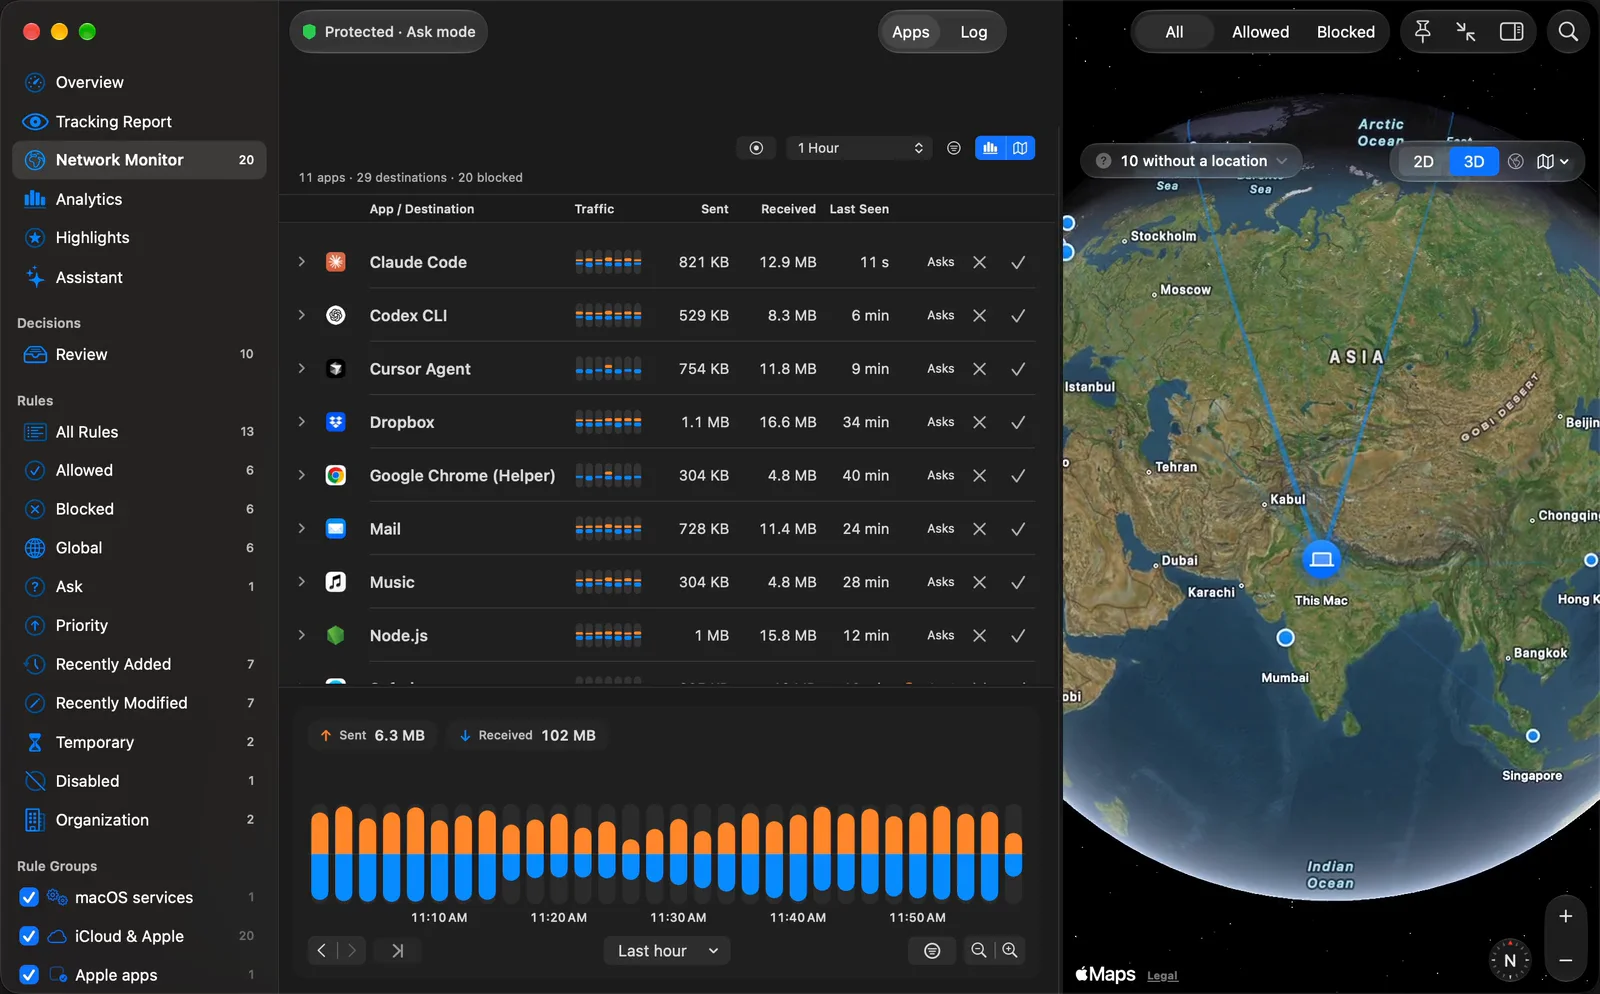
Outbound’s Network Monitor is a live list of every connection your Mac’s apps make: each app, the hosts it reaches and the bytes it sent and received. Search the list or explore the map and globe.
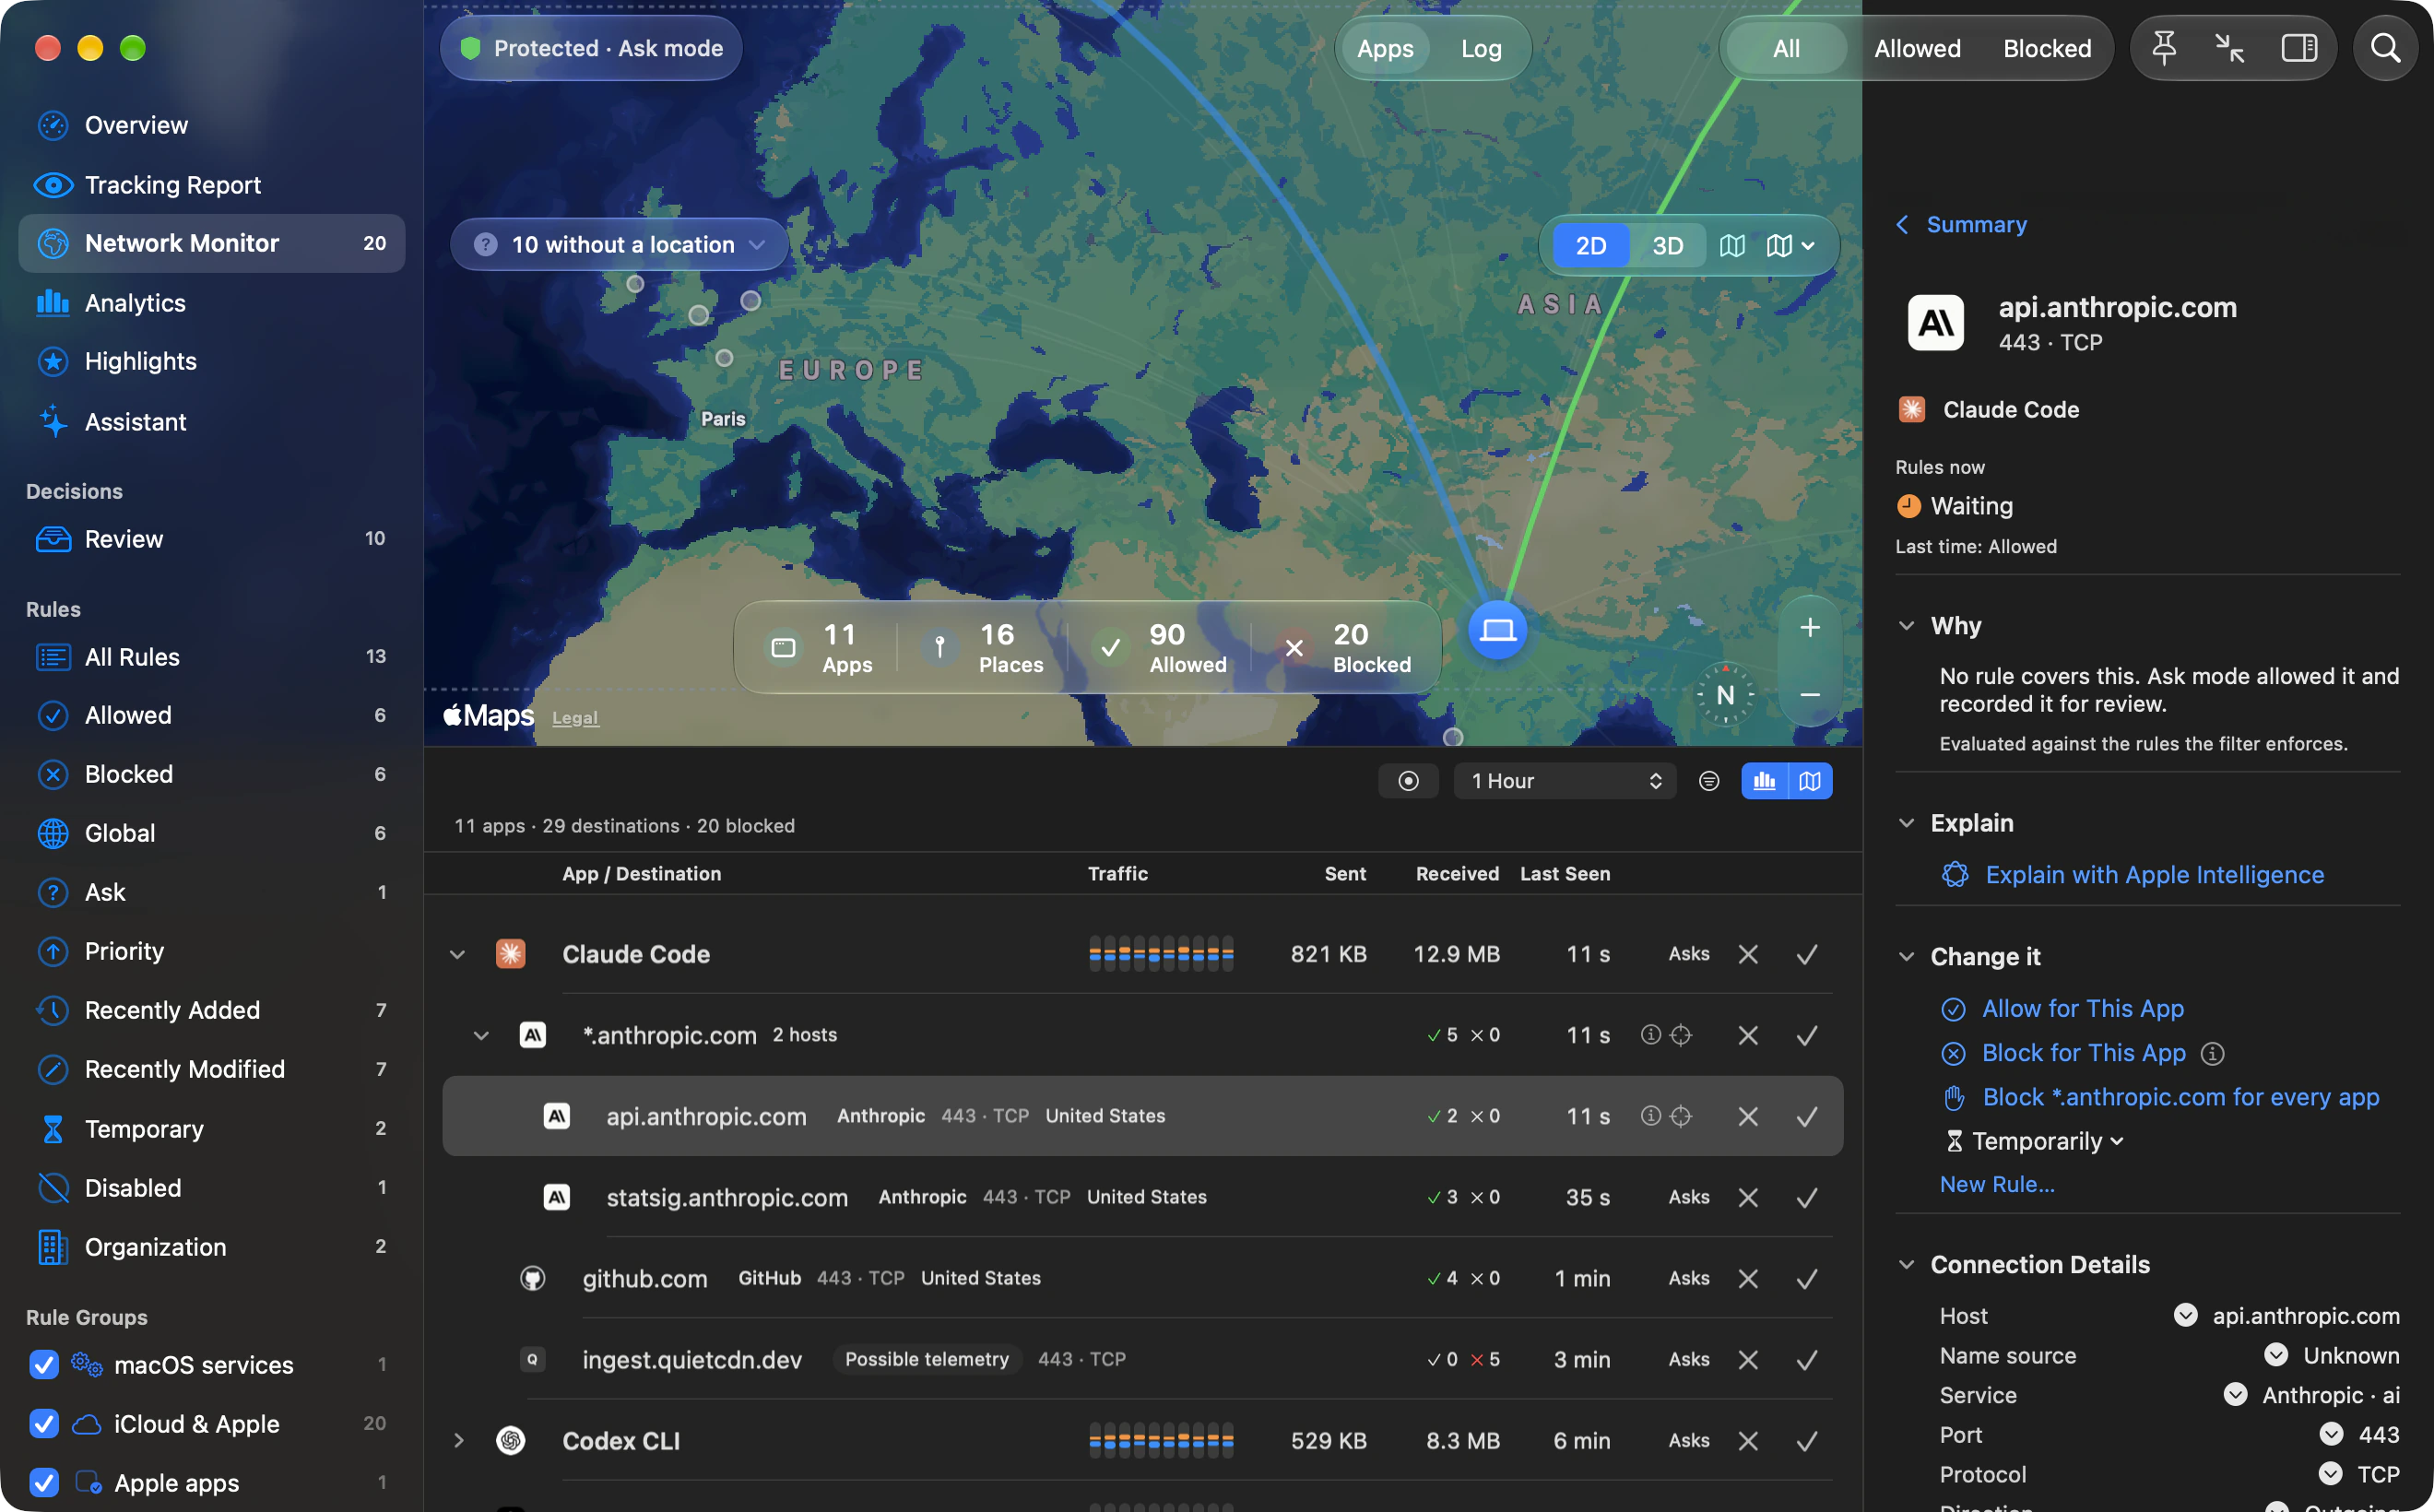
Network Monitor
Follow every connection.
Each app, the hosts it reaches and the bytes it sends. Search the list. Choose a period. Follow an agent.
Search what your apps connect to.
Type kind:ai and the list narrows to AI apps and the hosts they reach. Here, 3 apps, 7 destinations and 5 blocked.
Explore search and smart filters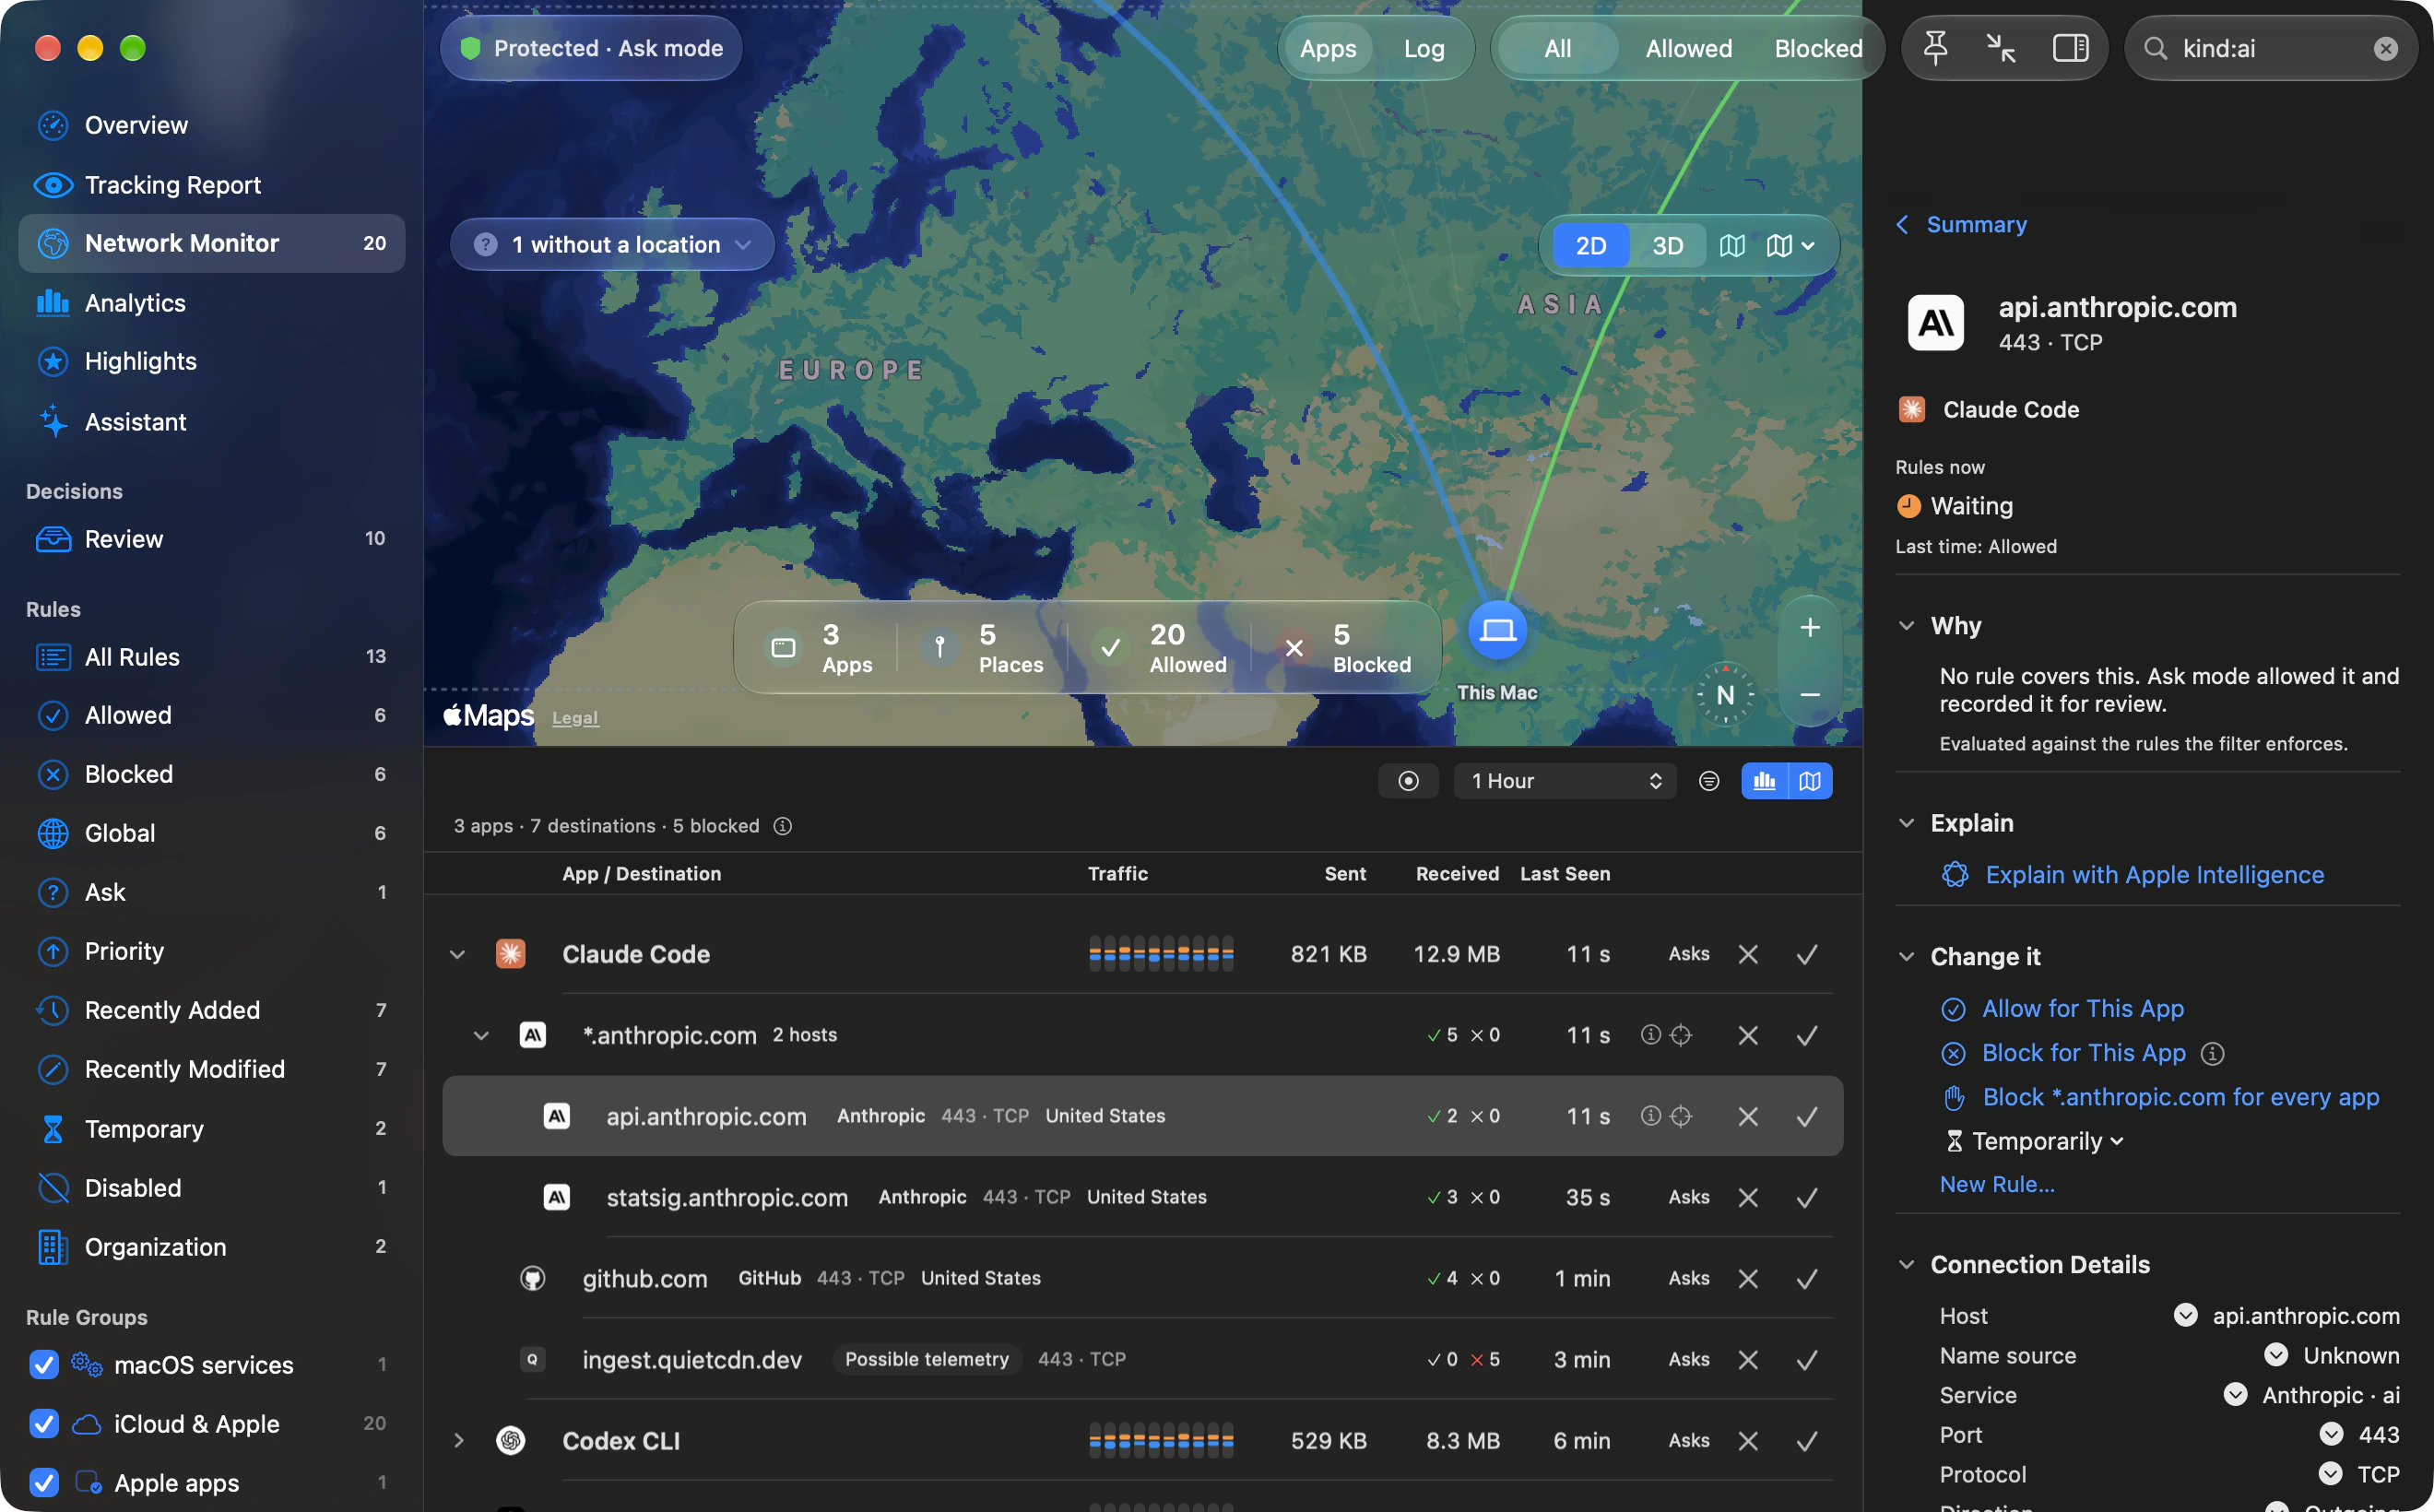
From a minute to a year.
Zoom the traffic chart from the last minute out to the last year, or page back. It totals what was sent and received in the period, and the list, map and inspector can follow it.
Read the traffic chart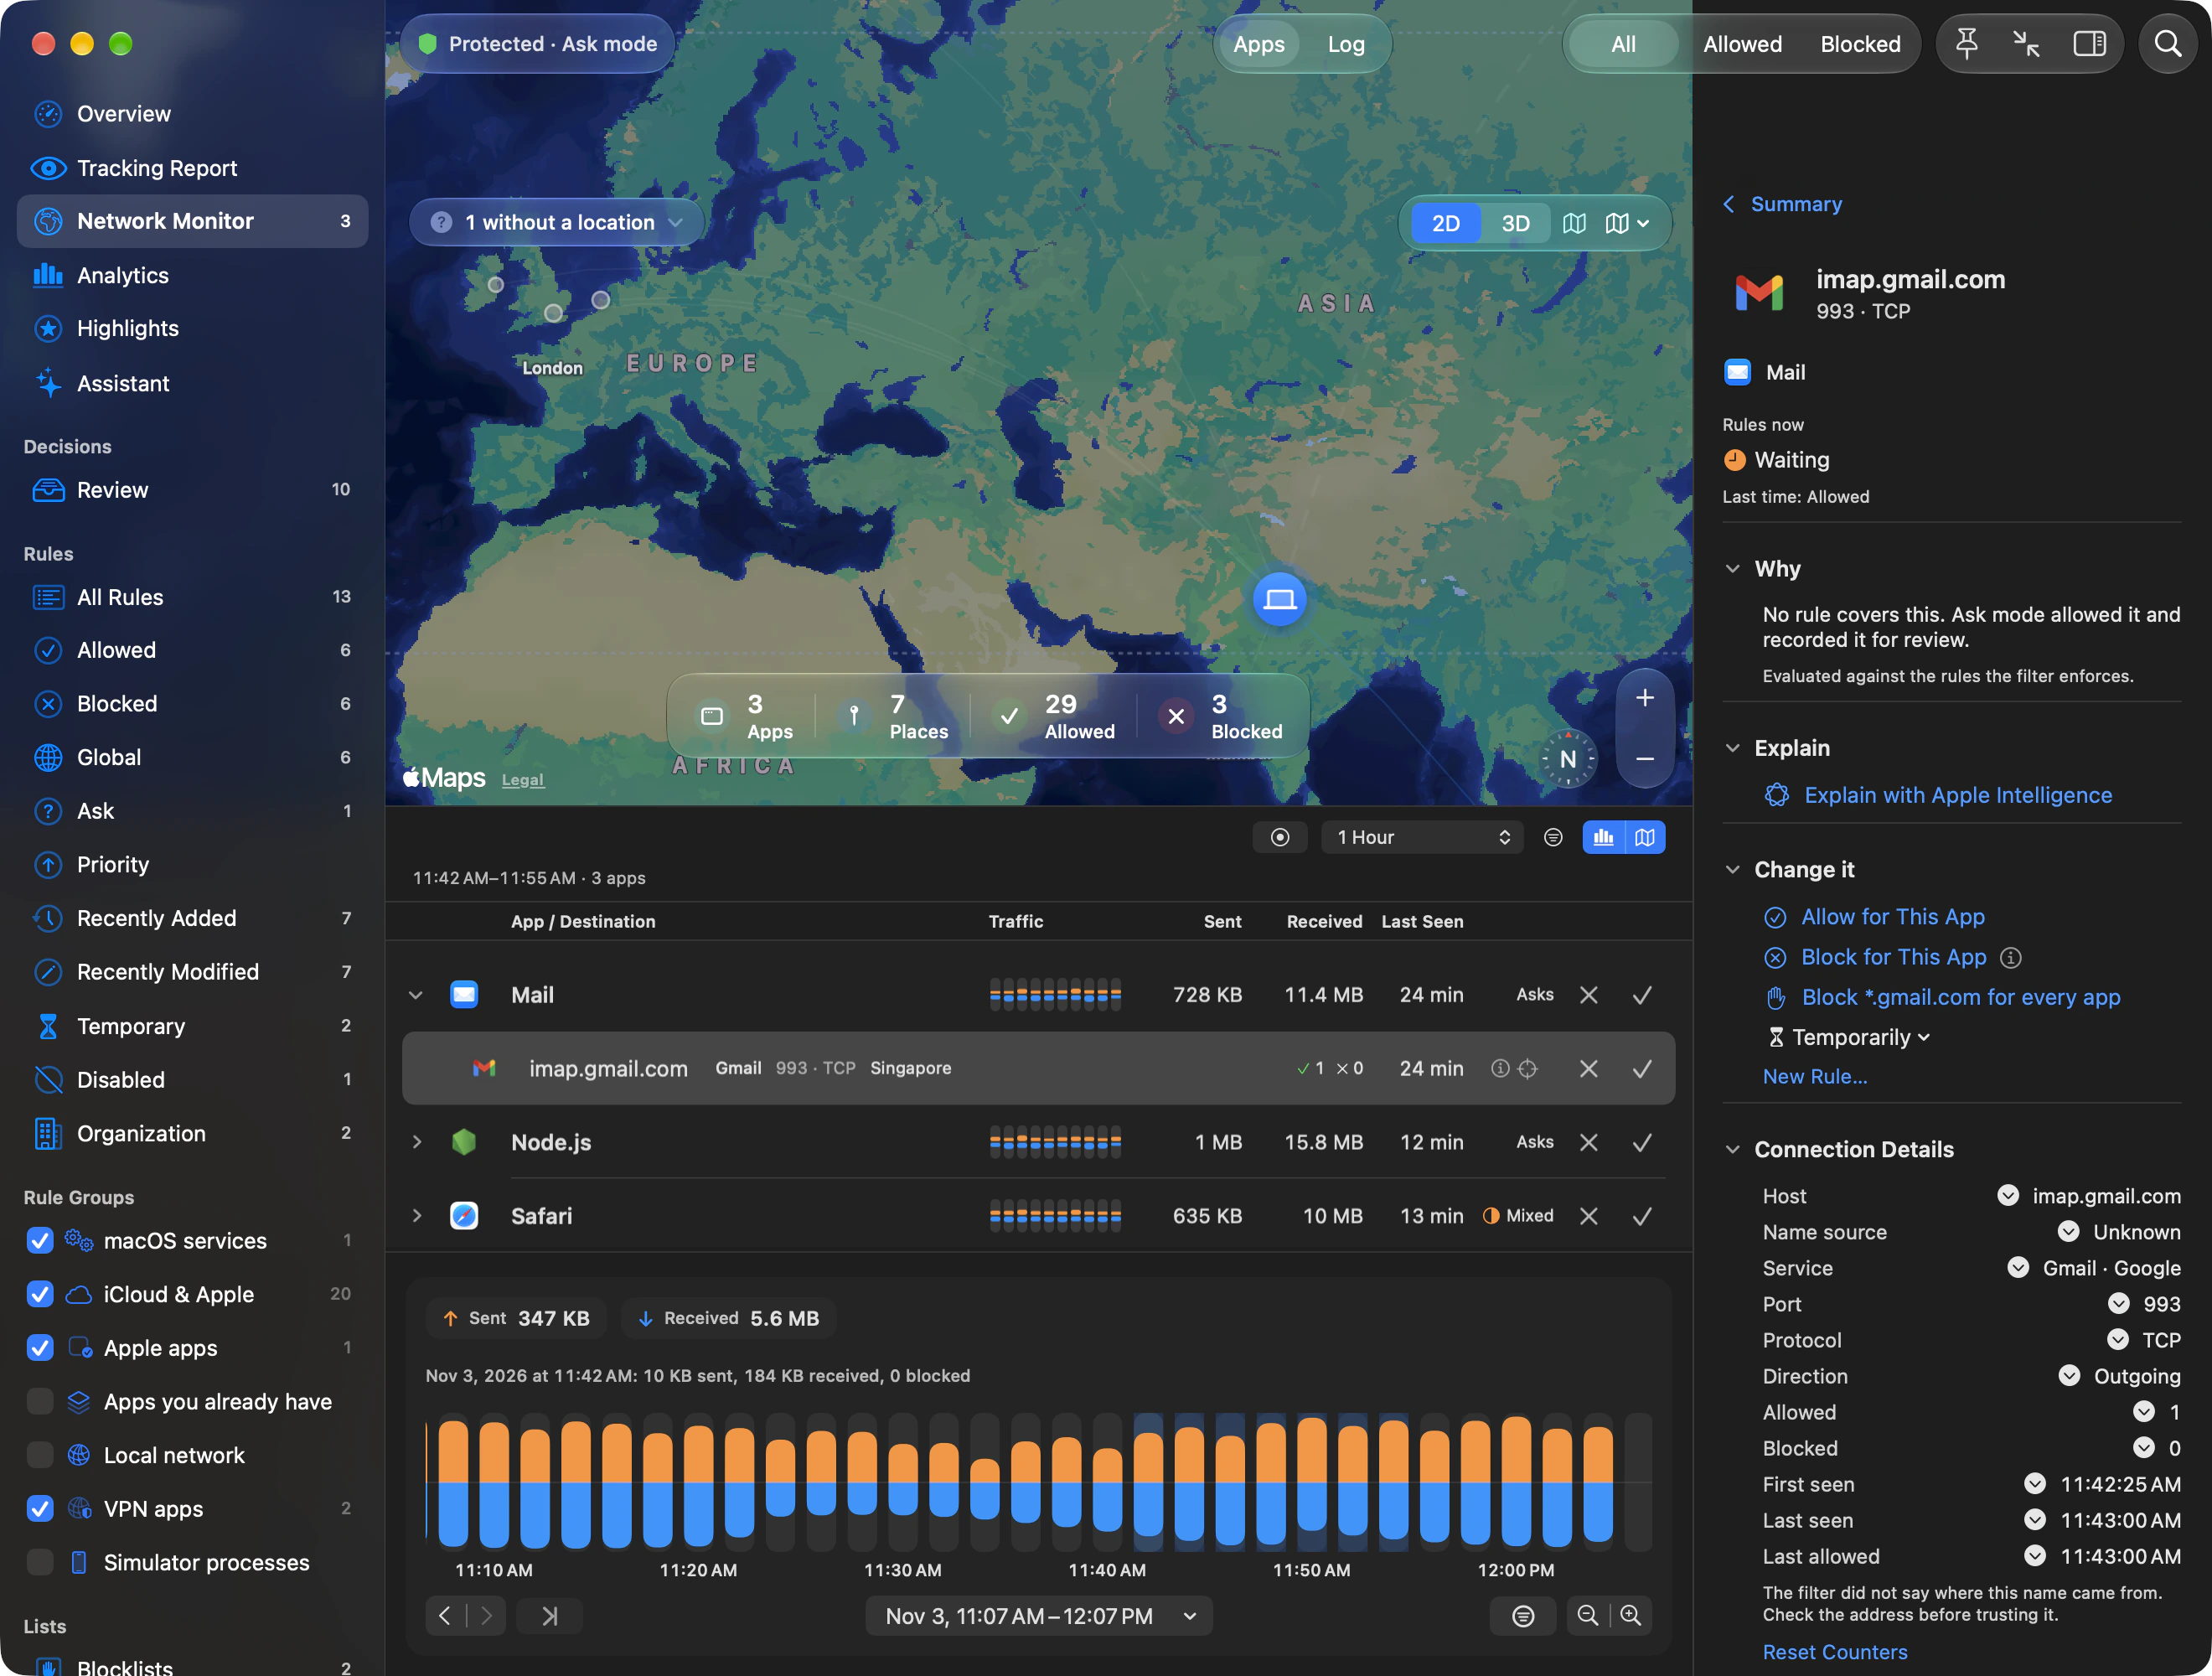
Where your agents send your code.
Claude Code, Codex and Cursor appear by name and icon. See each host an agent reached, and how often it was allowed or blocked.
Explore coding agents and their hosts
Connection Log
Every connection, in order.
Switch the Network Monitor to Log (⌥⌘L) for a dated list of each connection, newest first. Filter it, pause it to read, or follow one app as it connects.
Each row is one connection: its time, the app, the destination, the decision and what decided it, with the port, protocol and direction. The log reads the same Range as the app list and the history saved on your Mac.
Type app:, host:, country:, continent:, owner: or rule: to filter, then press Return to make each one a token. A menu narrows the log to allowed or blocked connections, incoming or outgoing ones, or those decided by a rule you have not approved yet.
- Pause
- Stops the list moving while you read. New connections are counted on the button until you choose Follow Newest.
- Follow Selection
- Shows only the selected app’s or destination’s connections. Pin Scope keeps it while you inspect other rows.
- Row actions
- Block or allow for that app, Show in Monitor, Show Rule and Copy Connection. Select several rows to inspect them or reset their counters together.
- How much it holds
- The newest 5,000 events live, and Load Older reads further back in saved history, up to 100,000 that match the filter.
The log takes the place of the list, the map and the traffic chart until you switch back to Apps. Connection Log in the manual ›
Inspector
Select anything to see why.
The inspector names the rule that decided a connection, or says what decided it instead. Then it offers the change.
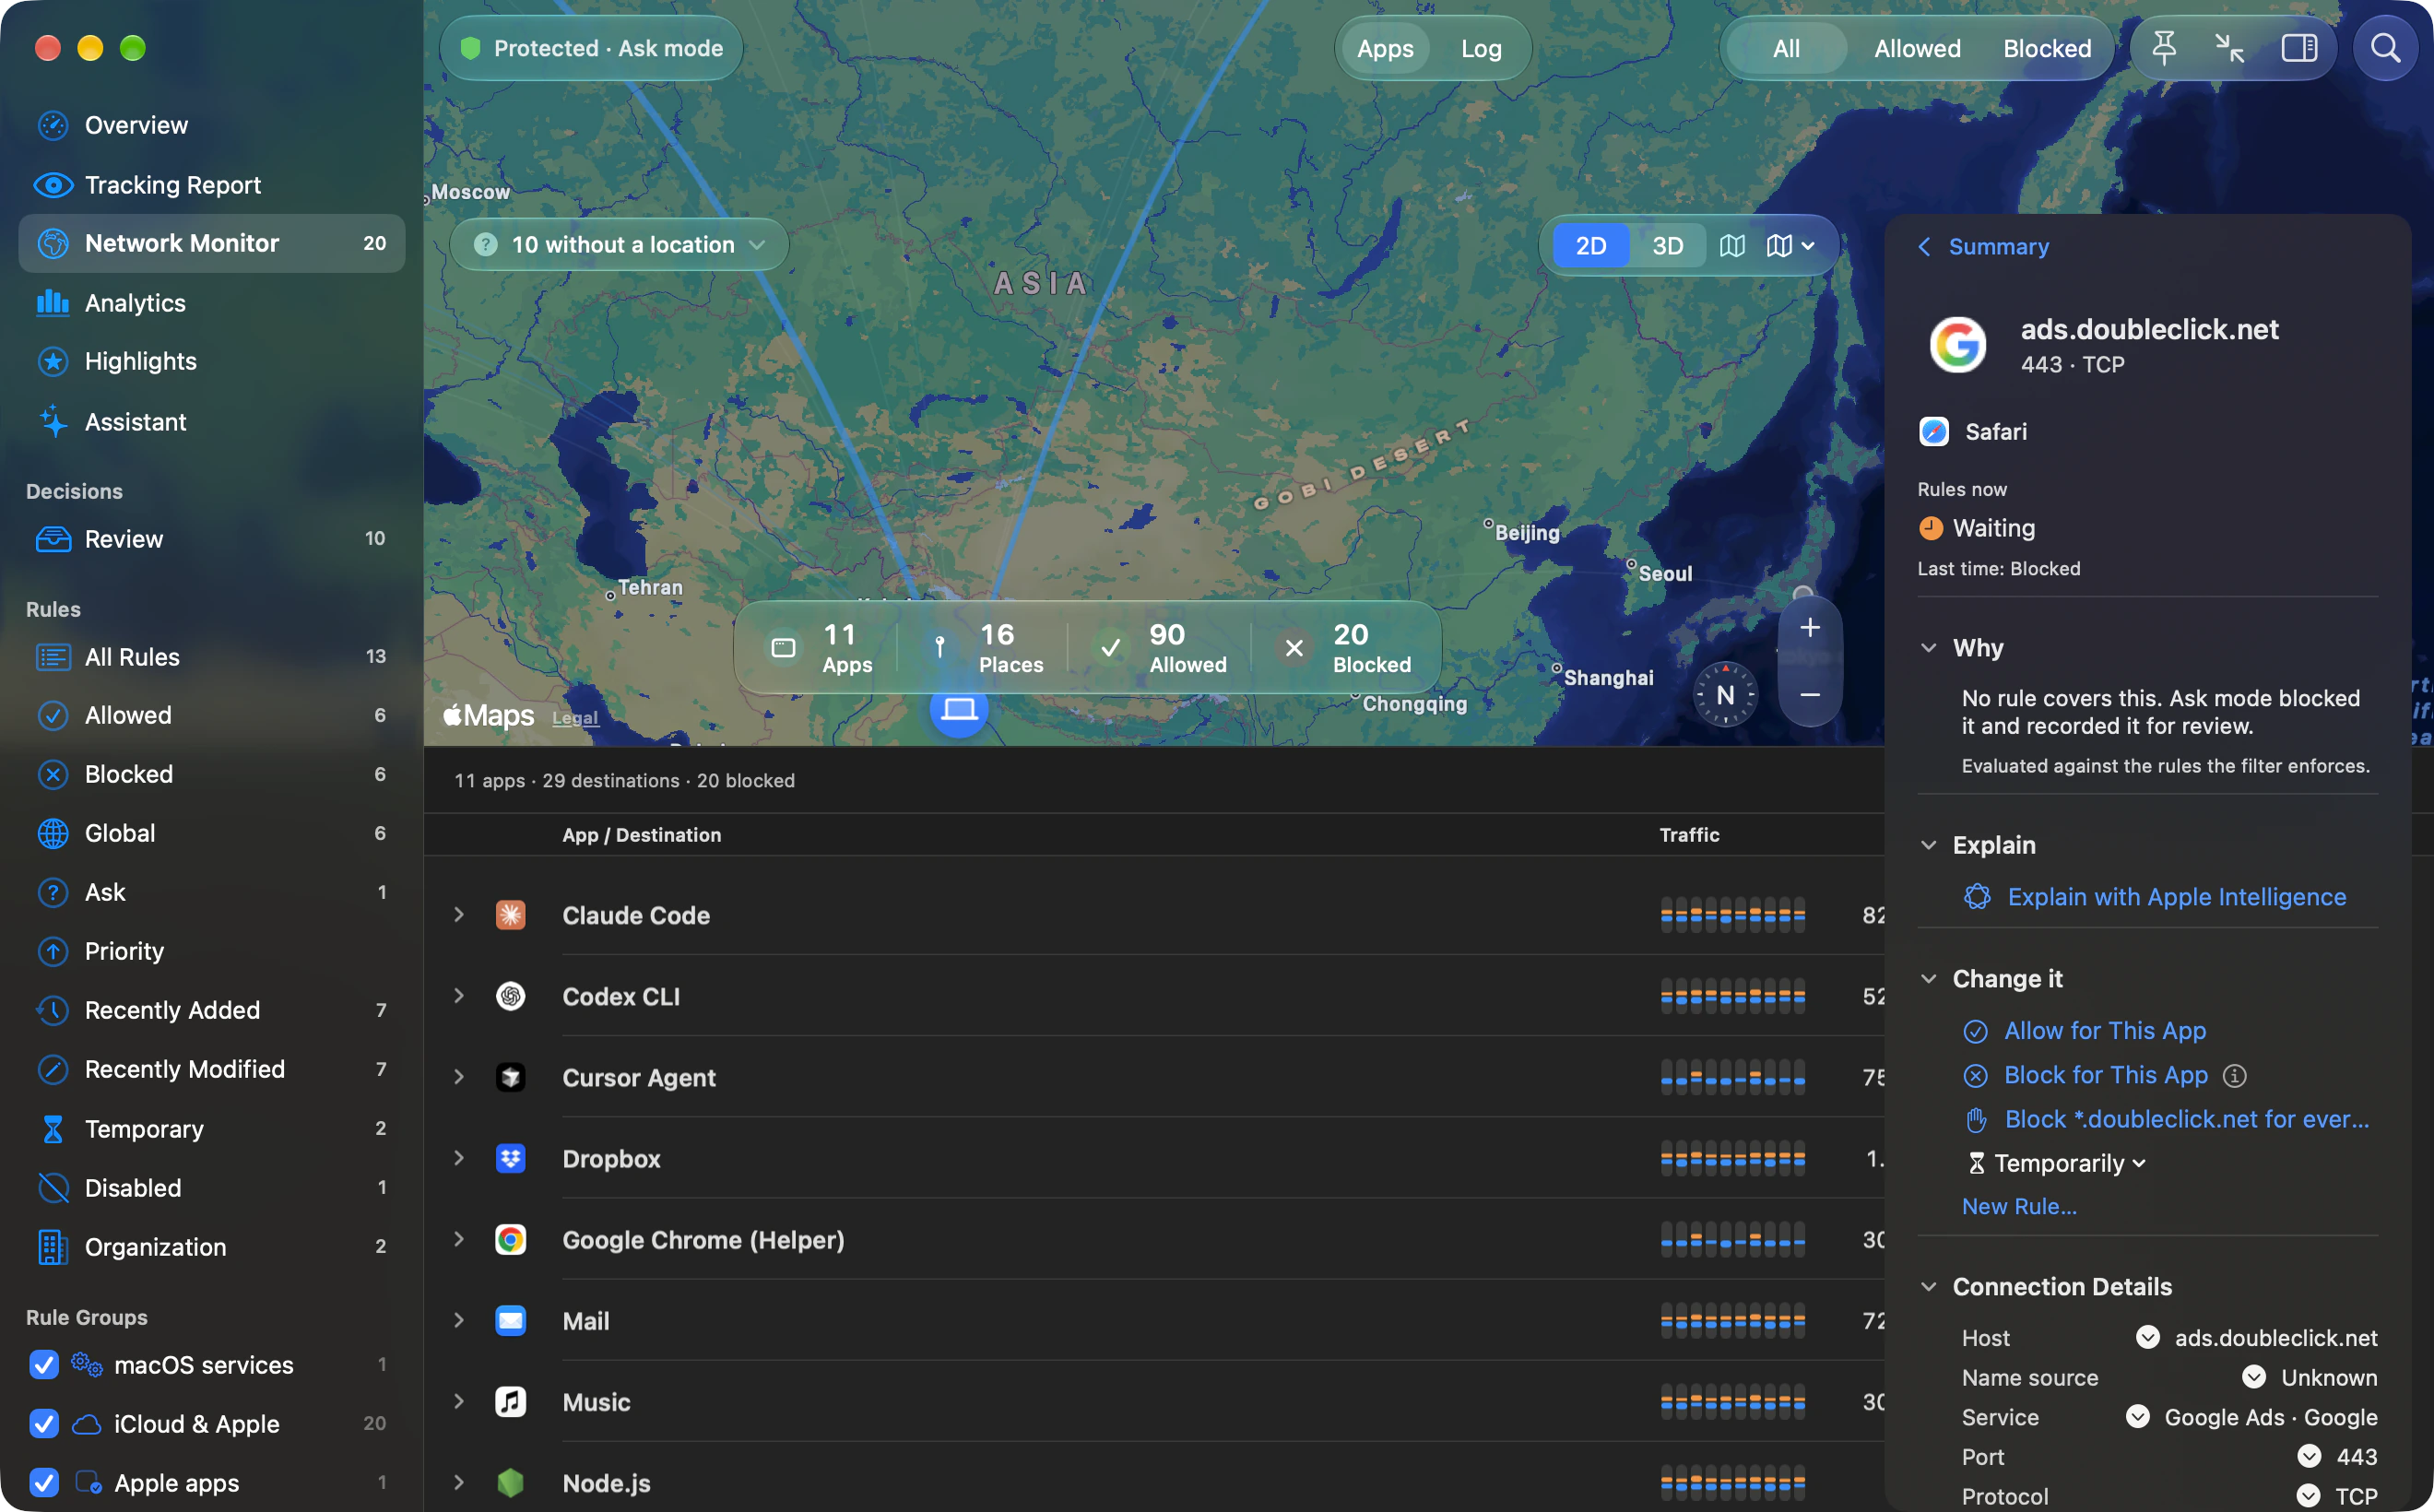
- Why. The rule that decided, or what happened without one: the mode, a pause, a timeout or a once-only answer.
- Explain. An explanation written on your Mac, on Macs with Apple Intelligence.
- Change it. Allow or block this host for Safari, or block *.doubleclick.net for every app.
- Connection details. Service, port, protocol, direction, and when it was first and last seen.
- Location. Dublin, Ireland, from the offline location database on your Mac.
Select an app instead for what it sent and received in the period, its rules and how often each one decided, its code signature and a Daily Data Limit.
Explore matching rules and data limitsGet to know Network Monitor
A closer look at every view.
From smart filters to saved history. Choose what you see, what stays and how you get there.
In depth
Search and filters
Search what your apps connect to.
Type kind:ai and the list narrows to AI apps and the hosts they reach. Here, 3 apps, 7 destinations and 5 blocked.
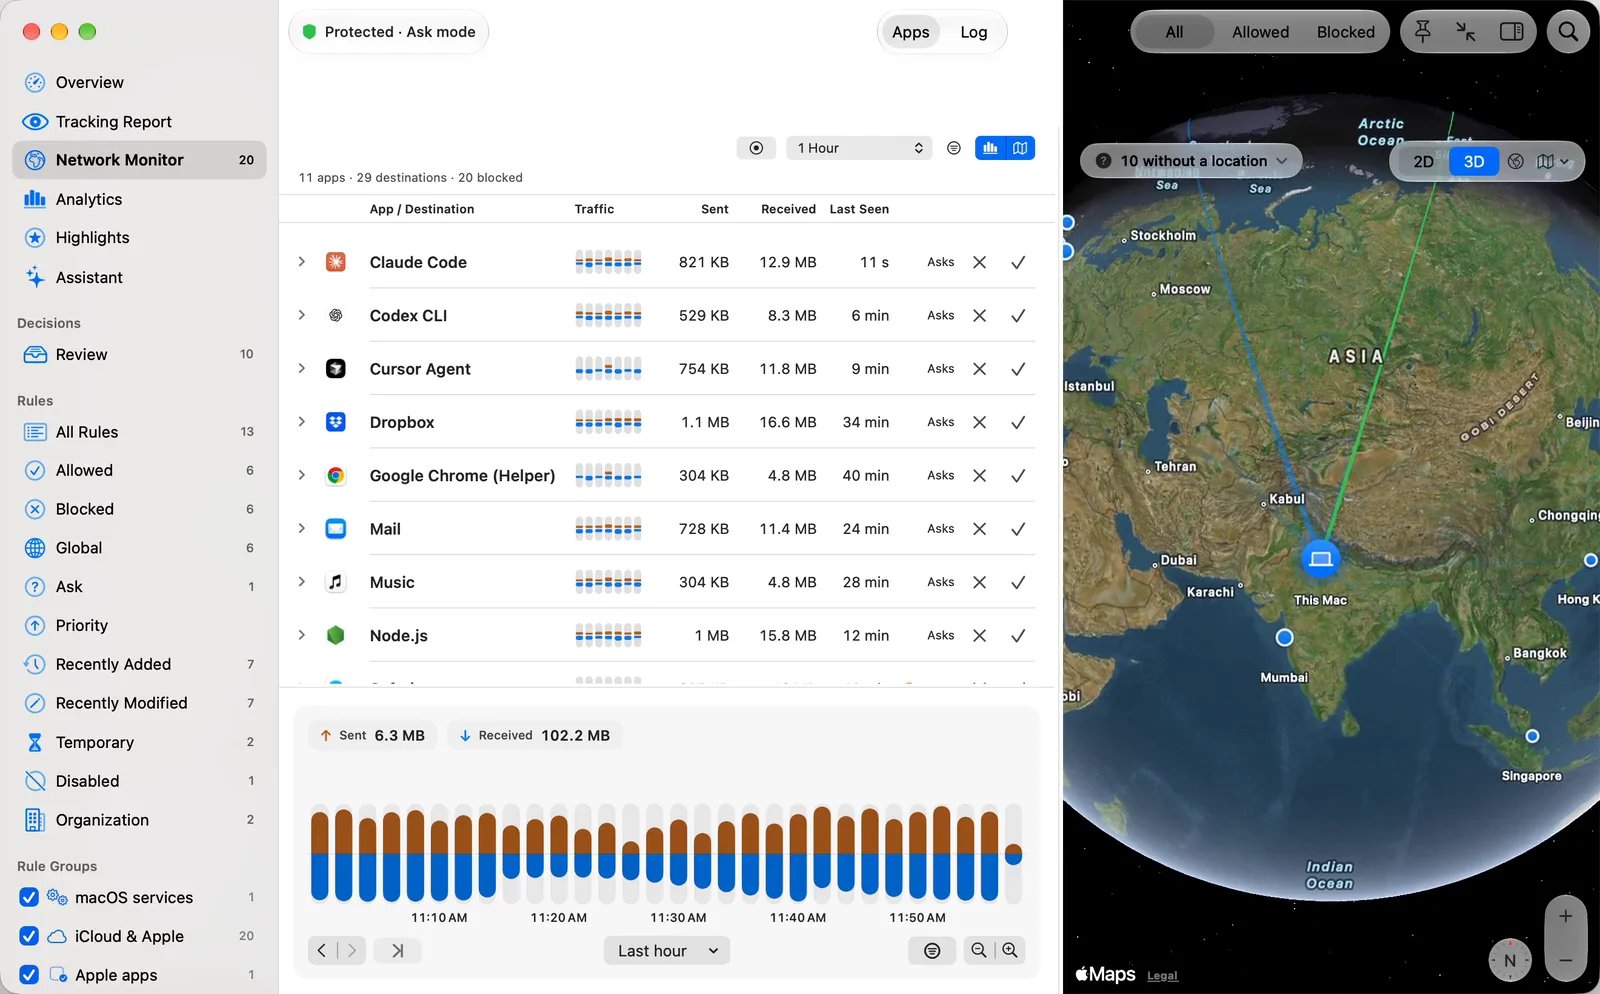
Apps are rows. Open one to see its destinations. Each app shows its recent traffic, Sent, Received and Last Seen, with allow and block beside it. Helpers count as the app they belong to. A destination shows its exact bytes once a connection to it has closed and been measured, and allowed and blocked counts until then.
The search field takes app:, host:, port:, country:, city:, continent:, owner:, proto:, direction:, rule: and tracker:, with quoted values such as app:"google chrome". A search narrows the traffic chart to the same apps.
The map sits beside the list, or above it in a narrow window. Locations come from an offline database on your Mac. Icons for apps and sites Outbound knows ship with it. Downloading icons from websites is off unless you turn it on.
More about the network monitor › See which apps use the internet, with or without Outbound ›
Smart filters
kind:ai- AI agents and coding tools
kind:ads- Ads and trackers
kind:unruled- Not covered by a rule
kind:new- Reached in the last 15 minutes
kind:unsigned- Unsigned apps
kind:apple- Apple services
kind:local- Local network
kind:abroad- Outside your country
kind:heavy- 100 MB or more in the range
Choose what the list shows
- Range
- Live, 10 Minutes, 1 Hour, 5 Hours, 24 Hours, 3 Days, 7 Days, 30 Days or All Kept History. The default is 1 Hour. 30 Days needs history kept for 30 days.
- Show
- All, Allowed or Blocked, and a menu that adds Decided by Unapproved Rule, Incoming and Outgoing, each with its count. From Now (⌘K) shows only connections from this moment; press it again to return to the whole range.
- Sort By
- Recent Activity, Name, Data Received, Data Sent, Total Data or Blocked Count. Recent Activity is the default and brings apps moving data to the top.
- Group By
- Two levels over app, domain and country, such as Country → App to see who reaches a place. App → Domain is the default (⌥⌘1 to ⌥⌘6).
- Connection types
- Loopback, local network, network extension, no-process and other users’ connections each have a switch. Turning one off changes the view, not your rules.
- Focus
- Right-click an app, destination or country and choose Focus to narrow the whole monitor to it. Press Escape to go back.
- Float on Top
- Keeps the Network Monitor above other windows while you work in another app (⌥⌘F).
- Show Apple Services Without Data
- Off by default. Quiet Apple-signed apps with no bytes and no blocks stay out of the list, unless there is no traffic sampler or you search with tracker:. Third-party apps stay visible.
An app lists its first 60 destinations, then Show All. When filters hide every row, Clear Active Restrictions removes them all at once.
Coding agents
Where your agents send your code.
An agent in your terminal can read your project and reach any server it likes. Outbound shows everywhere Claude Code, Codex or Cursor connects and how much it sent, and it can ask you first when the agent tries somewhere new.
- By name and icon
- Claude Code, Codex and Cursor appear by name and icon in the Network Monitor.
- Hosts and traffic
- You see each host an agent reached and how often it was allowed or blocked. The inspector adds the data sent and received once a connection closes.
- New hosts follow your rules
- In Ask mode, a connection no rule decides waits for your answer until the timeout. In Strict, it is blocked.
- Block one host, keep the agent
- One click blocks one destination for one agent. Its other destinations keep their own rules.
The AI Agents and Coding Tools filter brings the AI tools and services Outbound recognises into one list: Claude Code, Codex, Cursor, Gemini CLI, GitHub Copilot, Aider, OpenCode, Goose, Cline, Kiro, Amp and Qwen Code.
Analytics splits their traffic into apps, AI services and countries.
Which hosts Claude Code, Codex and Grok CLI contact › A firewall workflow for developers ›
Traffic chart
From a minute to a year.
Zoom the chart from the last minute out to the last year, page back through time, and read what was sent and received in each period.
Upload rises above the centre line and download falls below it, in your traffic colours (orange and blue by default). Two totals above the columns give what was sent and received in the period on screen. Point at a column for its time and rates. Arrow keys move the readout.
Zoom out (⌘−) and Zoom in (⌘+) step through 1 minute, 5 minutes, 1 hour, 1 day, 1 week, 1 month and 1 year. Previous period and Next period page through time, and Now returns to the present. Bar size sets how much time each column covers.
Turn on Show only connections in the visible period and the list, the map and the inspector follow the chart as you page. Drag across the chart to narrow the list to that time instead; a click clears it.
The chart keeps its history when you quit or restart Outbound. When a connection closes, the filter records the bytes it sent and received; the inspector shows them as Sent (closed) and Received (closed). The live bars on each app are sampled.
Inspector
Select anything to see why.
The inspector names the rule that decided a connection, or says what decided it instead. Then it offers the change.
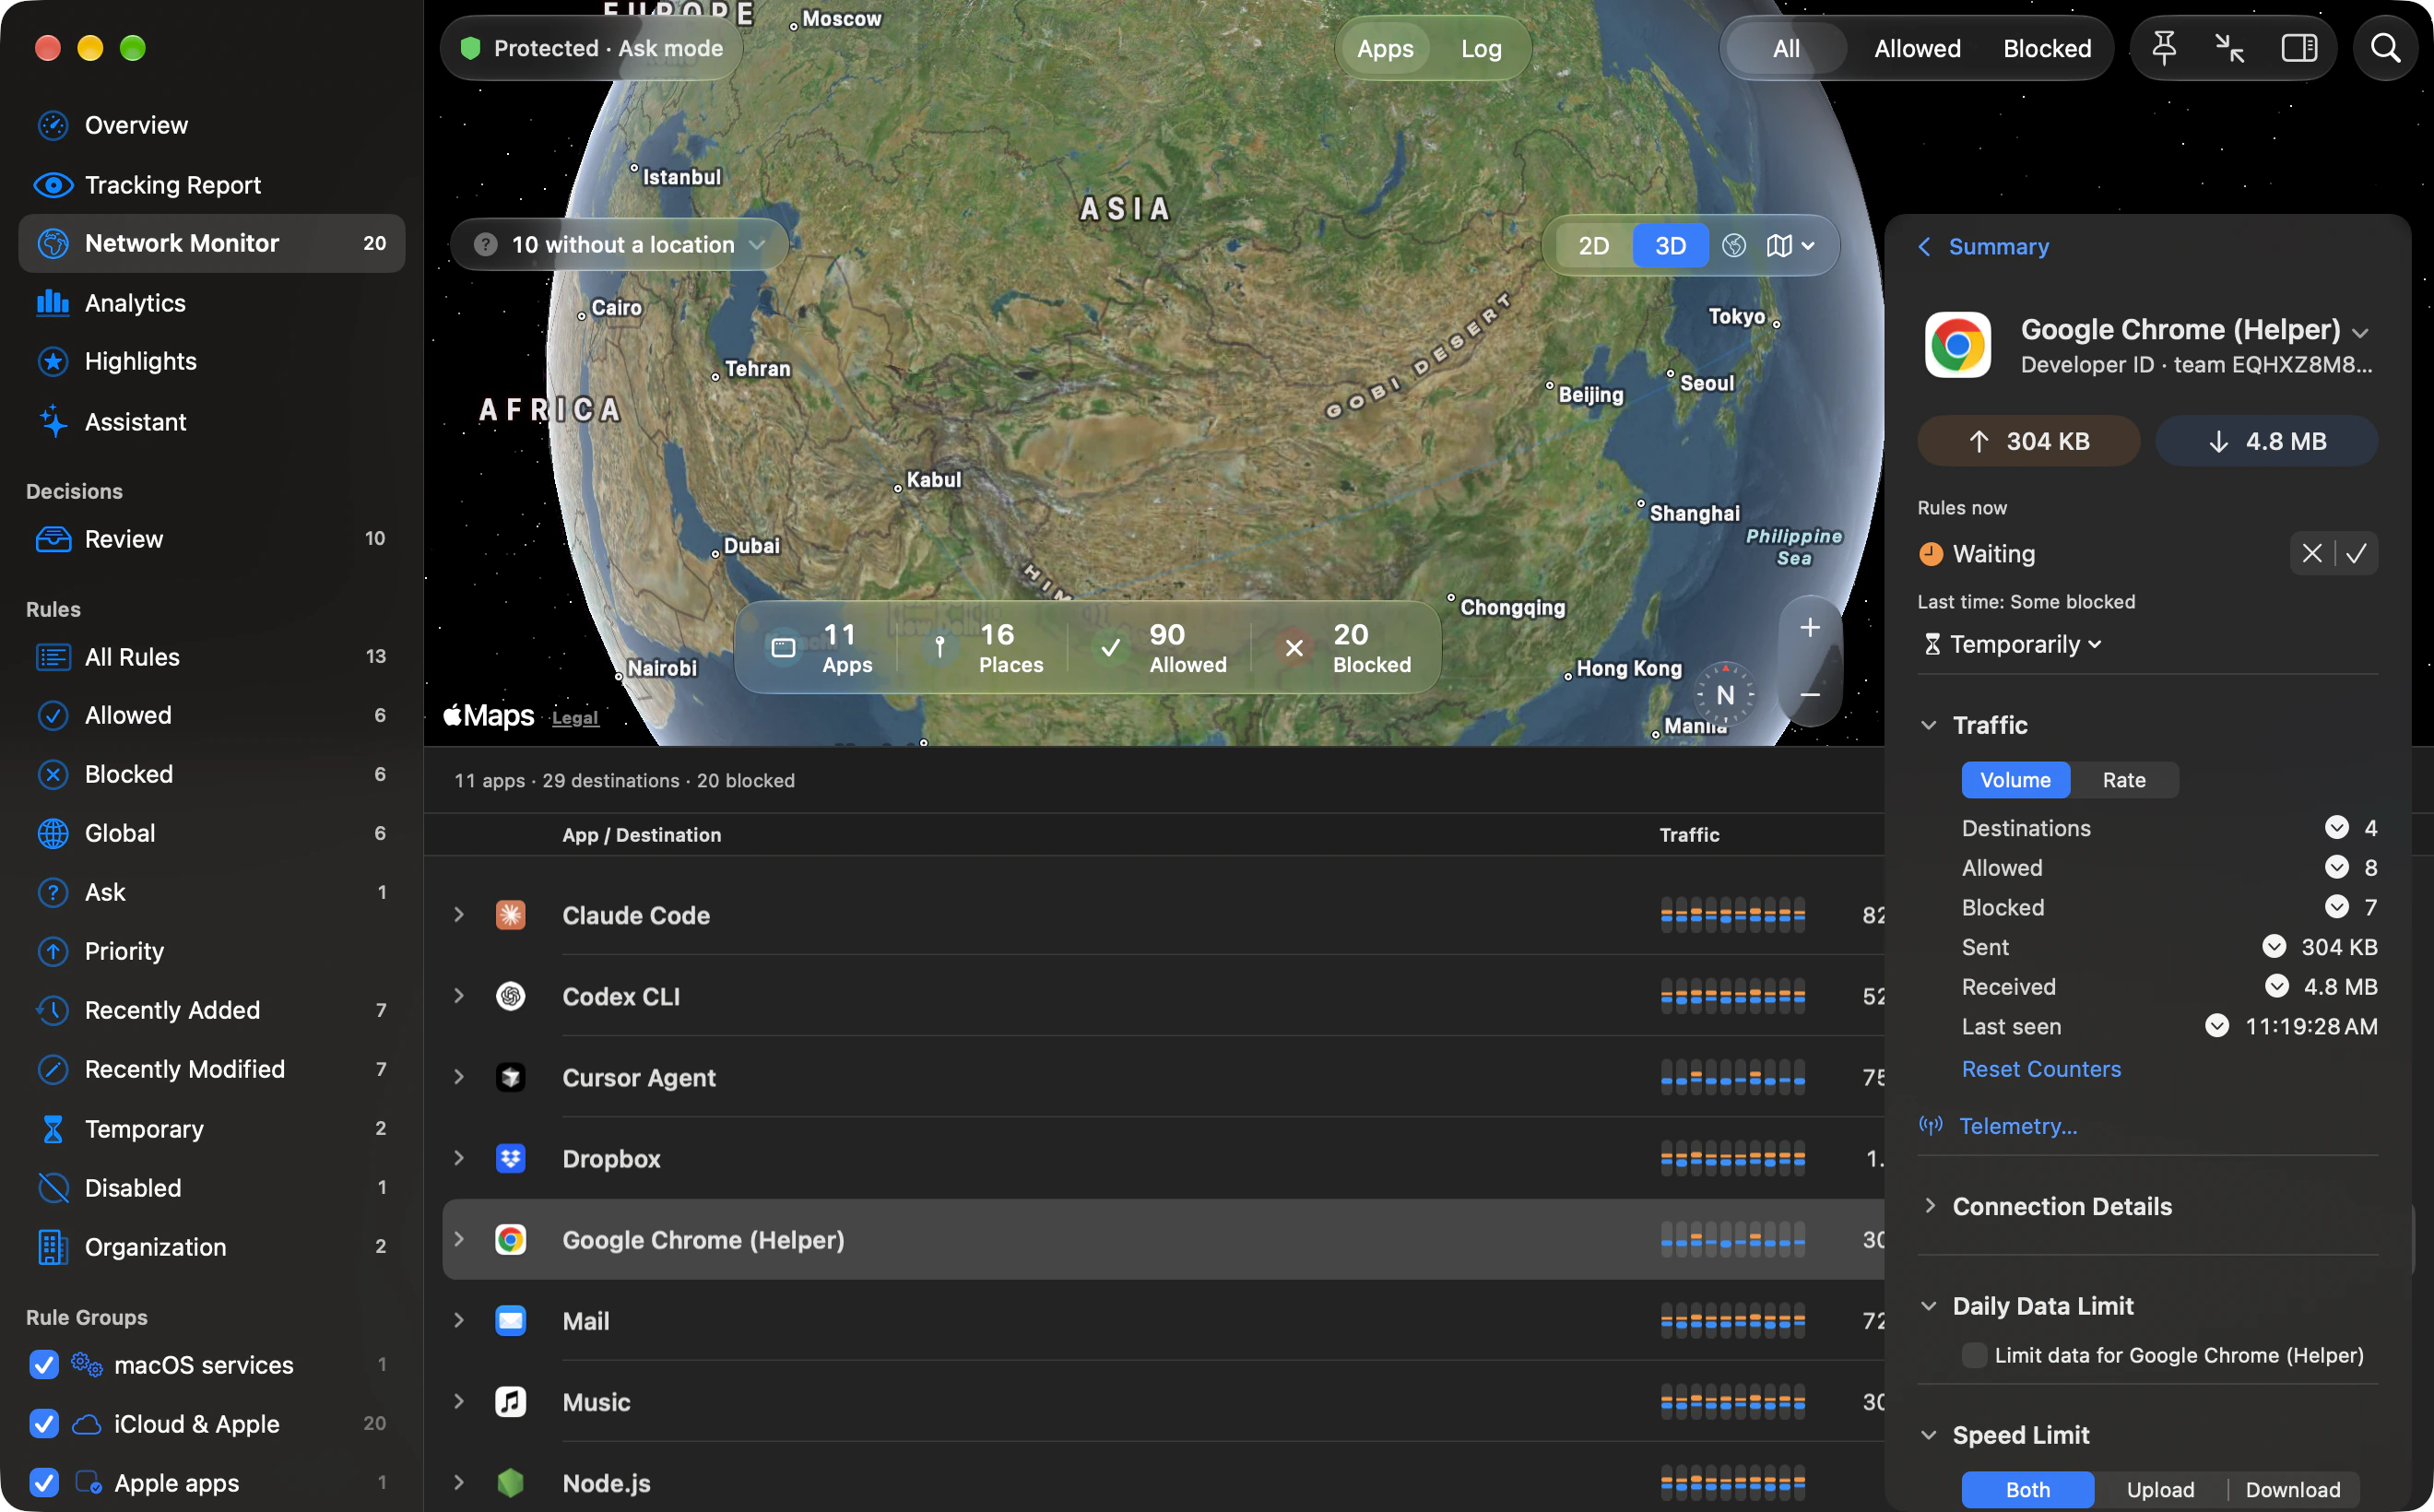
When a rule decides, the inspector shows it with Show Rule, says how many other rules also match but rank lower, and lists All matching rules with Decides on the winner. When a blocklist decided, the badge offers Allow for the app only; Allow for Every App asks you to confirm separately.
Select an app instead for what it sent and received in the period, with Temporarily to allow or block it for a while. Each of its rules says how often it decided, such as “Decided 12 connections · last 4:06 PM”, and a right-click edits, turns off or deletes it. Code Signature gives the status and certificate, and Identity history warns when the code on disk no longer matches.
A destination says where its name came from: supplied by the app, or corroborated by a DNS answer. When a blocklist blocked it, the badge names the exact entry and list.
A daily data limit for each app
| Control | What you choose |
|---|---|
| Limit data for APP | Turn the limit on for the selected app. A new limit starts at 500 MB a day; you can set 50 to 100,000 MB a day. |
| Notify Me | The default. You’re told at 80 % and again at the limit. |
| Block Until Midnight | You’re told at 80 %. At the limit, Outbound adds a block rule that removes itself at midnight. |
Outbound checks the day’s totals every five minutes. Data budgets in the manual ›
Want data saving on hotspots rather than per-host rules? Outbound vs TripMode ›
Settings › Monitor
Choose what stays on your Mac.
The live list limit and saved history are separate settings.
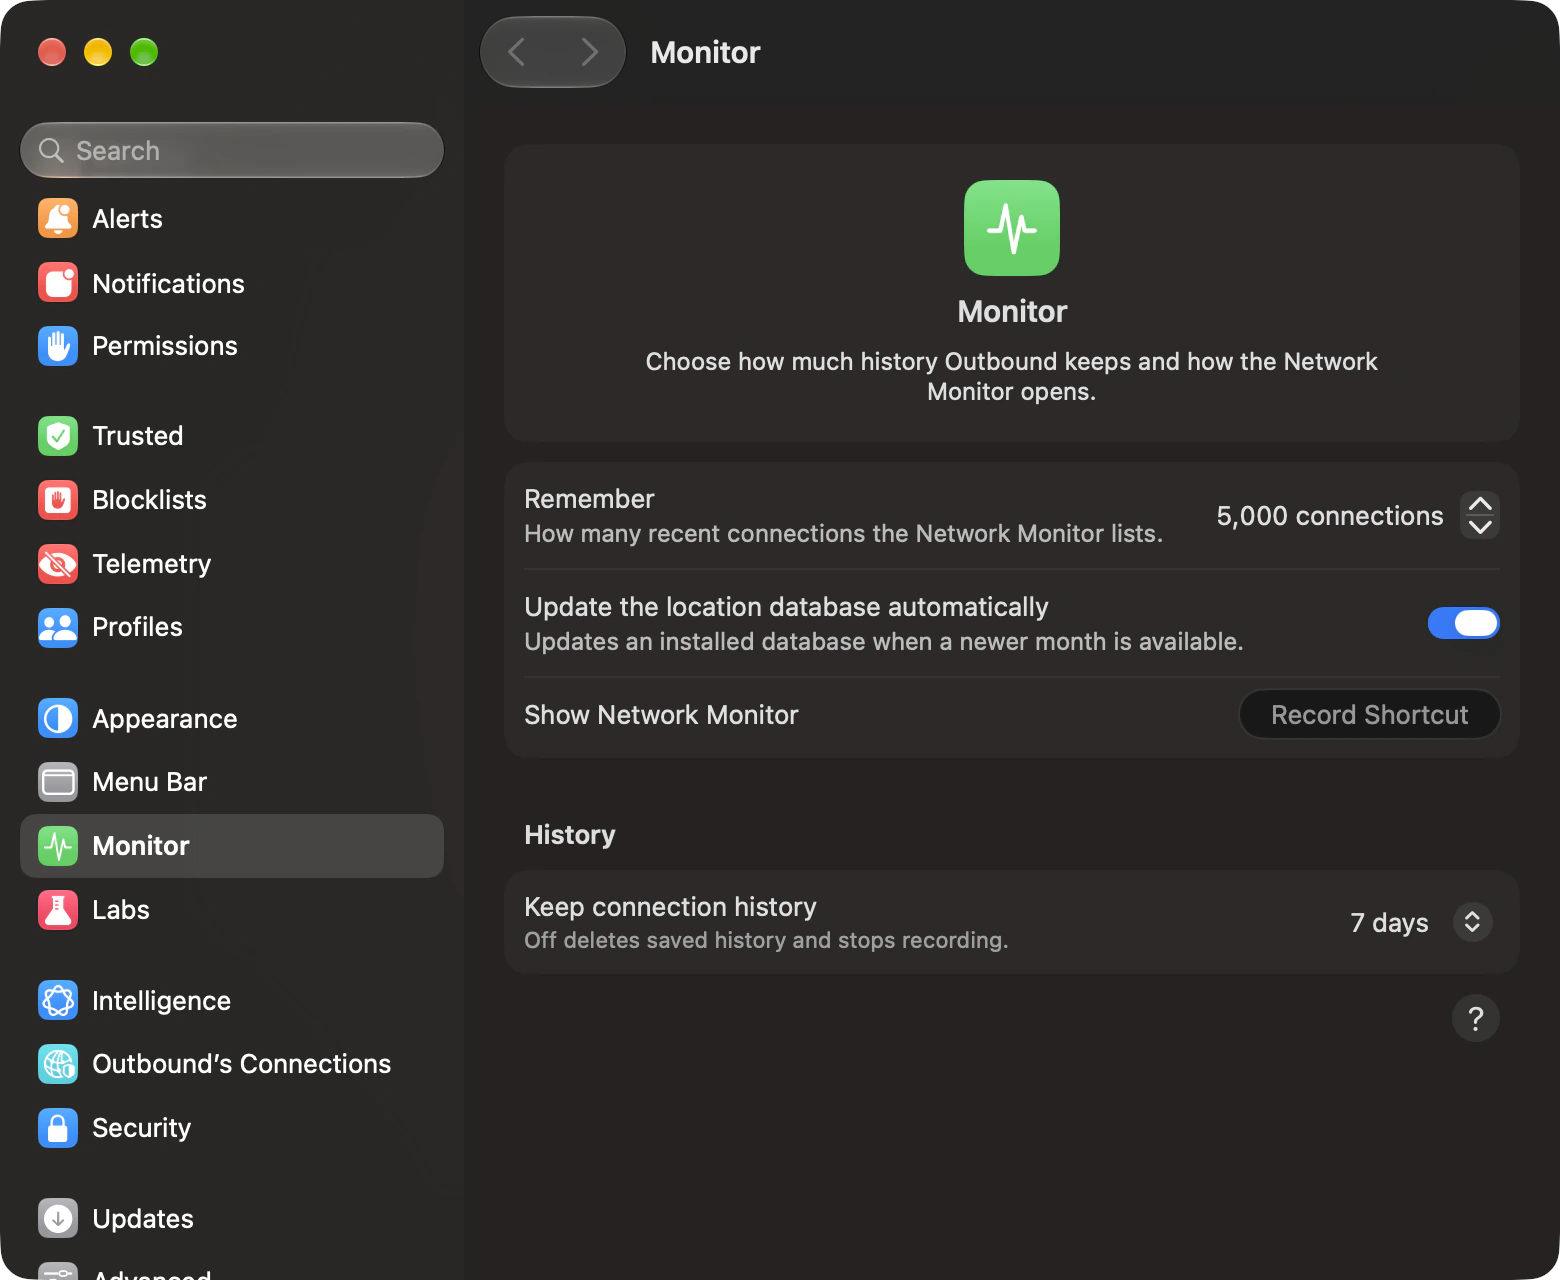
- Remember N connections
- Keep 1,000 to 50,000 distinct connections in the live list, in steps of 1,000. The default is 5,000.
- Keep connection history
- 1 day, 7 days, 30 days or Off. The default is 7 days. Off deletes saved history and stops recording it.
- Locations
- Download Locations (60 MB) installs DB-IP’s offline database. Lookups happen on your Mac. Update and Remove let you manage the installed copy.
- Location
- Where the map and globe centre and the arcs start. System Time Zone is the default. Choose another time zone, set a spot from the map, or Determine Automatically with Location Services, which saves only a location rounded to about 10 km.
- Update the location database automatically
- On by default. While the main window is open, Outbound checks at launch and every six hours. Removing the database stops automatic downloads until you download it yourself.
- Hidden Connections
- Show Again restores a hidden app or domain. Hiding stops recording its connections from that moment; its rules still apply. Delete Saved History, in the monitor’s right-click menus, erases what was already saved.
Appearance and website icons
- Appearance: Automatic, Light or Dark. Window tint: Standard, Graphite, Ocean, Forest or Sunset. Buttons, selections and links use your Mac’s accent colour.
- Traffic colours: Orange and Blue, Magenta and Blue, Orange and Teal, Pink and Cyan, or Mint and Blue. The pair applies to graphs, bars and the menu bar meter.
- Show website icons is on by default and uses icons that ship with Outbound. Download icons from websites starts off. Turn it on to fetch icons from each site and keep them on your Mac; no icon service sees the sites your apps reach.
Read, export or delete history from the terminal
outboundctl history list --since 2026-10-19lists time, app, remote and verdict. Add--appto match a name, signing identifier or path.outboundctl history export --since 2026-10-19 --format csvwrites CSV to standard output. Use--format jsonlfor JSON Lines and--untilfor an end date. Both commands are read-only.- CLI exports leave
bytes inandbytes outblank because they supply no byte totals. Unreadable history produces an error rather than a partial export. outboundctl history deletewith--app,--hostor--domainerases one app’s or destination’s saved history. It never deletes every app’s history at once.
Map and globe
Choose the view for the space.
The Network Monitor’s Map Style and the Labs globe’s Theme are separate controls.
| Style | What you see |
|---|---|
| Standard | Land, water and borders in 2D; satellite imagery with place names in 3D. |
| Muted | Softer colours in 2D; satellite imagery without labels in 3D. |
| Satellite | Photographic imagery. Uses more memory. |
| Dots | Outbound’s drawn world without map tiles. Uses the least memory and graphics. |
The map starts in 3D. Switching between 2D and 3D keeps your stored style. Select a place to narrow the list to it; select it again to clear.
Globe controls in Settings › Labs
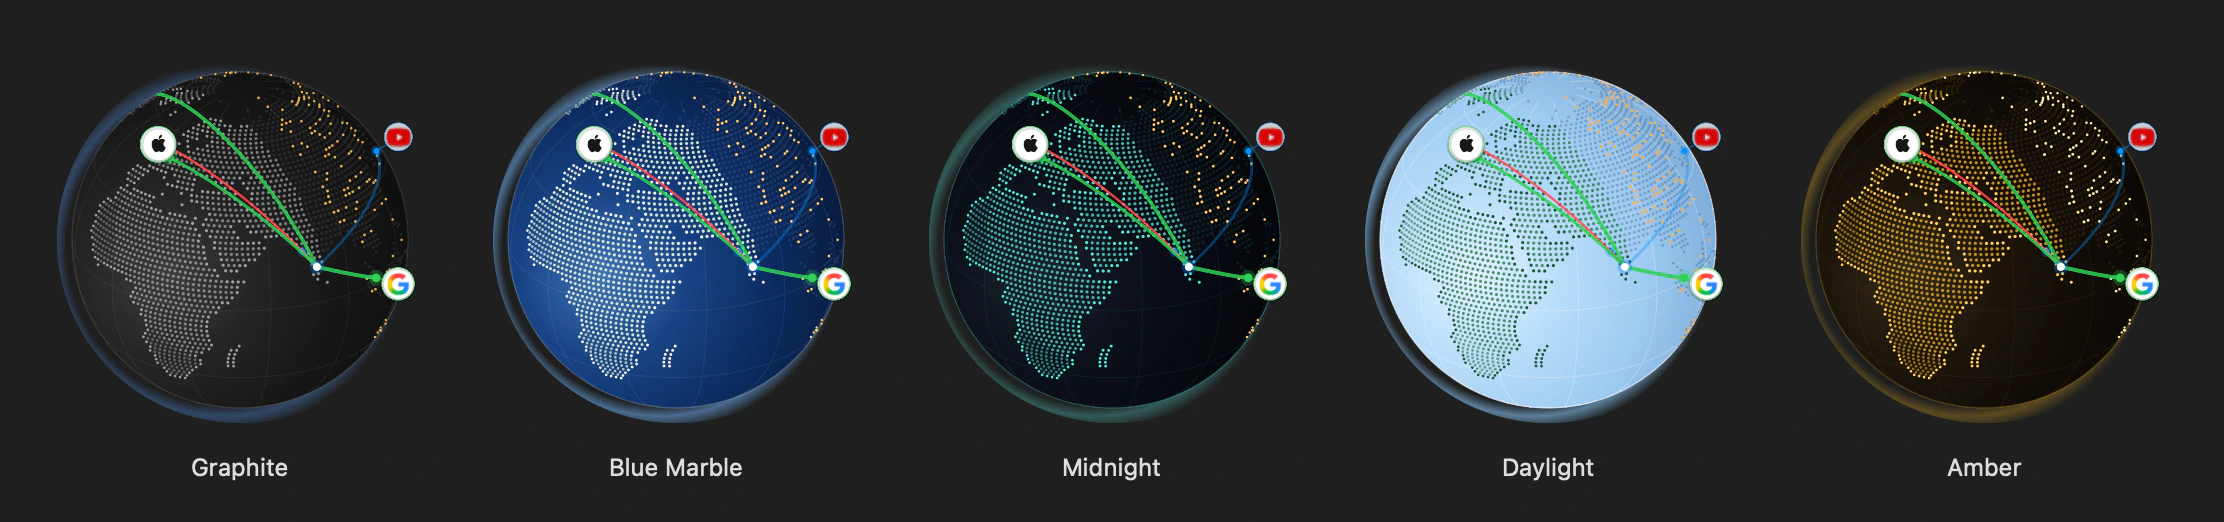
- Theme
- Graphite follows your Mac’s light or dark appearance. Blue Marble, Midnight, Daylight and Amber keep their own palettes.
- Icons shown
- Choose 0 to 10 destination icons, with 6 by default. Icon size and Country flags on icons have their own controls.
- Light and turning
- Real sunlight (day and night), City lights at night and Atmosphere glow each have a switch. Turning speed runs from Still to 12 degrees a second.
- Smoothness
- Battery saver, Balanced or Smoothest sets automatic redraws to 15, 30 or 60 frames a second. Reduce Motion stops the globe animating on its own.
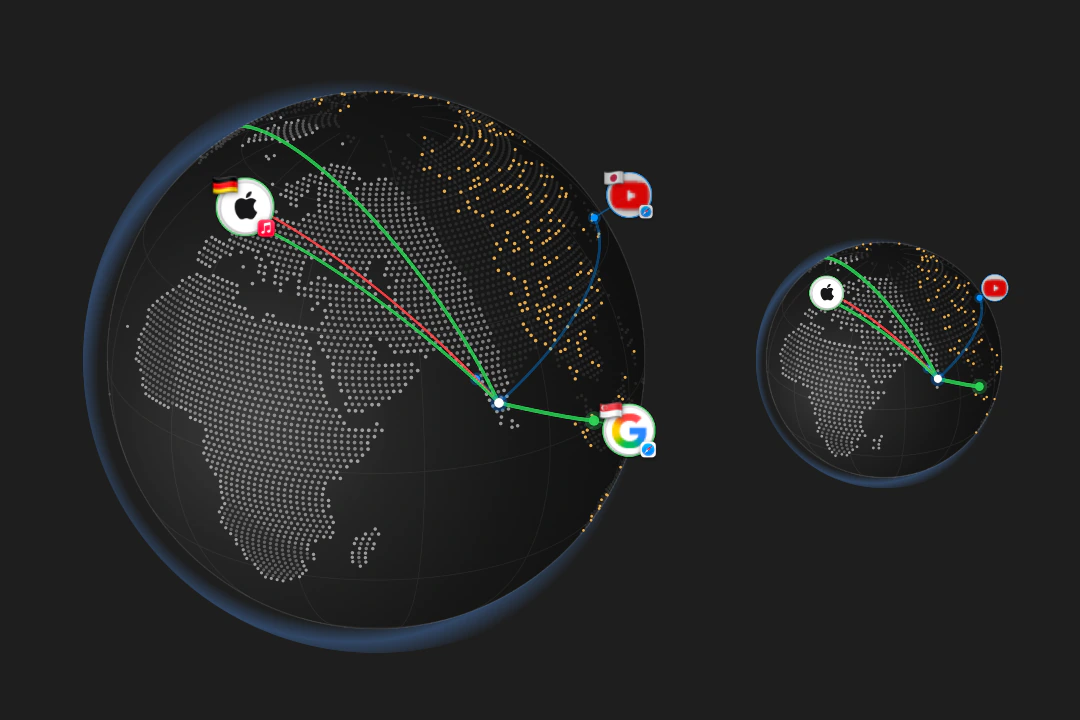
Move the floating globe
- Floating globe starts off in Settings › Labs. The background agent keeps it above your windows while the main window is closed, with routes from the monitor’s range and current upload and download rates.
- Drag the rate pill to move it. Pinch to resize it from 140 to 480 points, or use the Size menu. Double-click to open the Network Monitor.
- Minimize to a Dot keeps a live 60-point dot. Click it to restore the globe.
The Network Monitor map comes in 2D and 3D, with Standard, Muted and Satellite styles from Apple Maps, and a Dots style Outbound draws itself. Turn on the floating globe in Settings › Labs and it lives on your desktop: resize it, drag it anywhere, pick a theme.
- Icons mark destinations, with curved routes over the globe.
- Right-click the map and choose Set This Mac’s Location Here to start the arcs from your own spot.
Labs
Set how the extras behave.
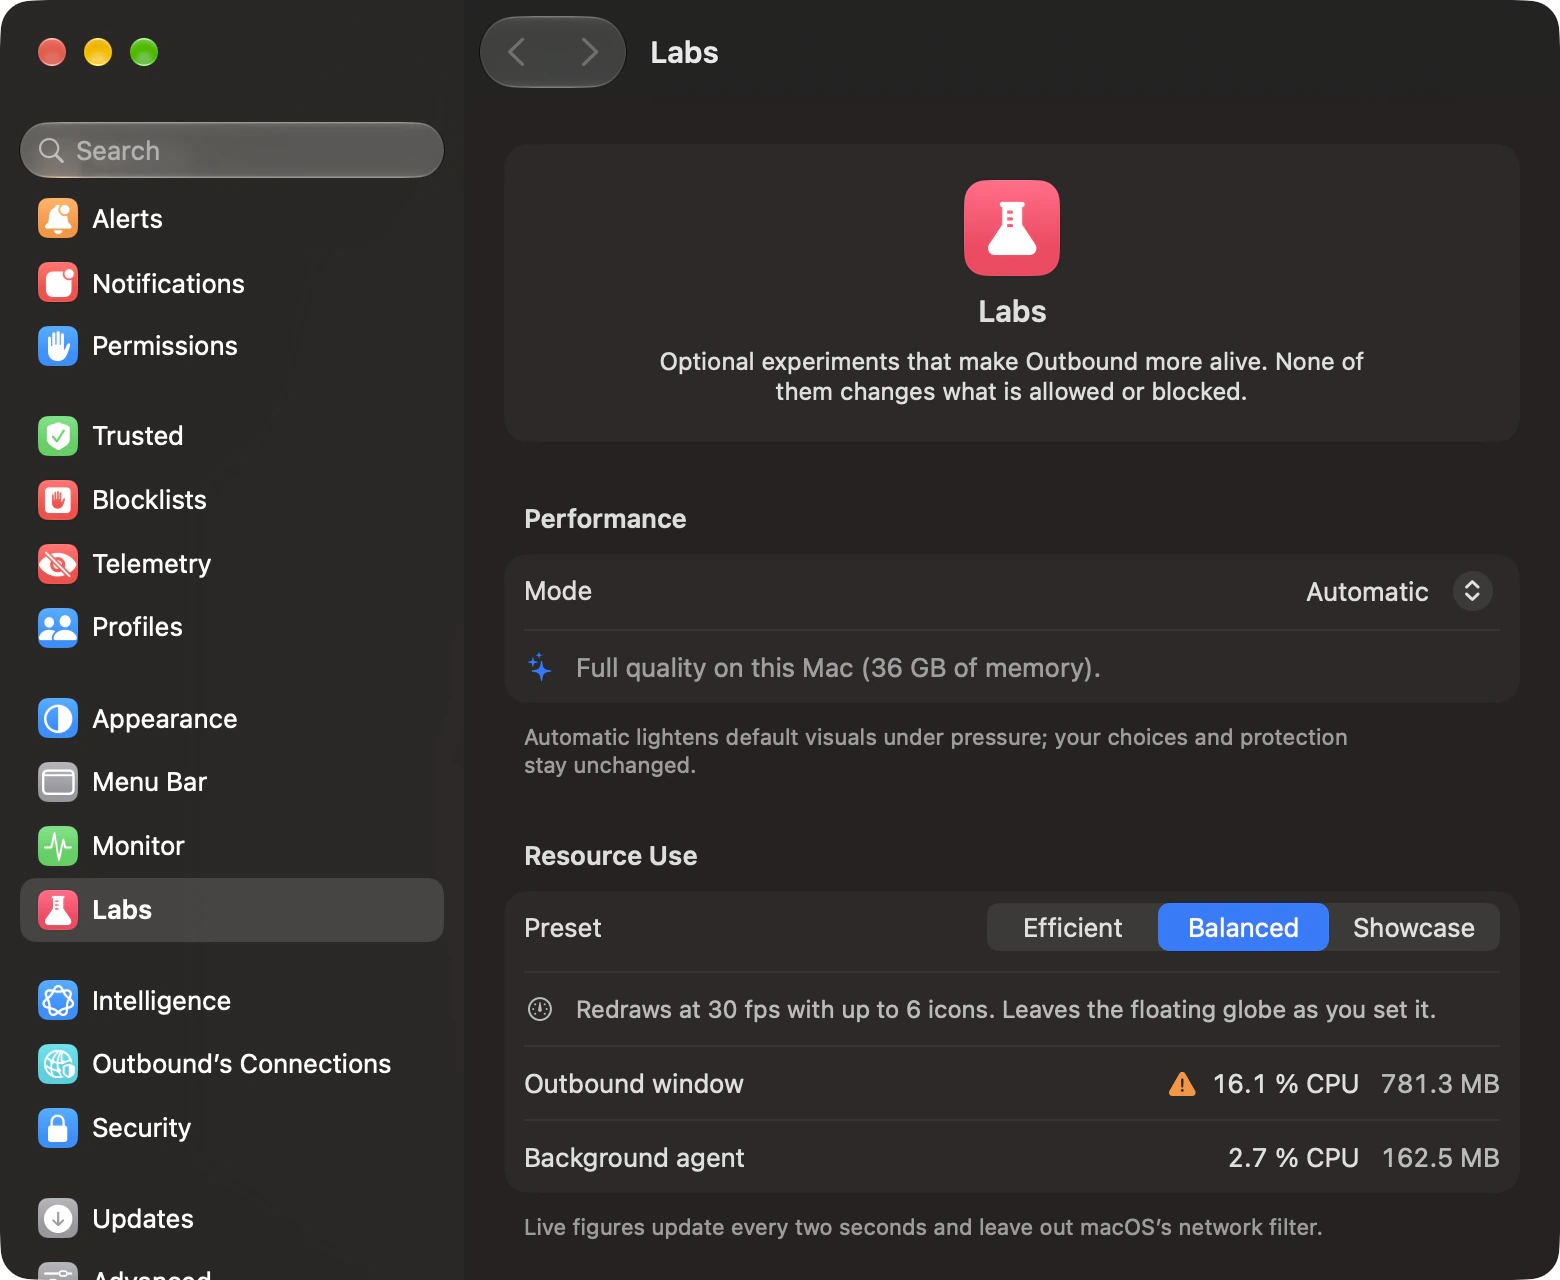
The Labs controls in Settings change only the visuals, never what Outbound allows or blocks.
- Notch island
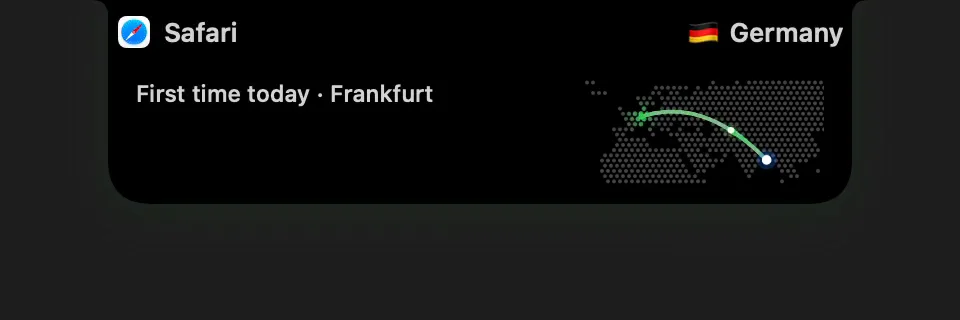
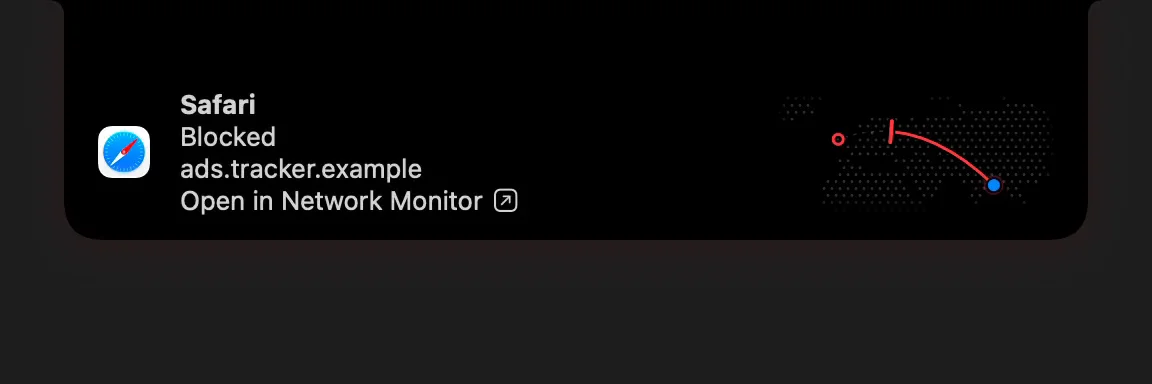
- On by default. First contacts are counted by country across apps and reset each day. The capsule is sized to fit around the camera notch; on a display without one, it hangs from the menu bar’s centre.
- Show blocked connections in the island
- On by default while the island is enabled. Blocks come from the filter’s actual decisions, so blocklist blocks are announced too. Ordinary events appear at least eight seconds apart; a pending block takes priority over a first contact.
- Island stays for
- Choose 2 to 10 seconds, with 4 seconds by default. Hover to hold it open; click to open that destination in the Network Monitor. Show a Sample previews either kind of event.
- Live globe in the Dock
- Off by default. While the window app runs, its Dock icon shows a still globe with routes from the monitor’s range. Refreshes are scheduled every 15 seconds; efficient mode skips refreshes less than 59 seconds apart.
Performance and resource use
- Mode: Automatic, Always efficient or Always full quality. Automatic uses efficient visuals at 8 GB of memory or less, in Low Power Mode, when your Mac is hot or when memory is short. Protection stays the same.
- Preset: Efficient turns the floating globe off; Balanced leaves its switch as you set it; Showcase turns it on. Presets also set smoothness, icons, turning and lighting.
- The live resource meter shows CPU and memory for the Background agent and Outbound window. It does not count the filter running inside macOS.
Extras you can switch on
They live in Settings › Labs. Each one switches off separately, and none of them changes what Outbound allows or blocks.
- Notch and menu bar activity · Notch island
- The first time today that your Mac reaches a country, a capsule with the route grows out of the notch and then folds away. It can tell you about blocked connections too, at most once every eight seconds.
- Live world in the menu bar
- A small world map beside the meter draws a line to each place your apps reached in the last few seconds.
- World widget
- See the monitor’s routes on your desktop or in Notification Center, with what was allowed and blocked.
- What each one costs
- Efficient is Outbound at its lightest. Showcase turns all the experiments up, and it uses the most battery. Floating globe: Uses more. Live world in the menu bar: Light. Notch island: Light.
- Live globe in the Dock
- While the window is open, its Dock icon shows the globe with the routes from the monitor’s range, refreshed about every 15 seconds.
- A live world at the end of setup
- The last page of setup draws each of your first connections as it happens.
Around the edges
Smaller windows, quicker ways in.
A compact window, the menu bar panel, and a palette that goes anywhere.
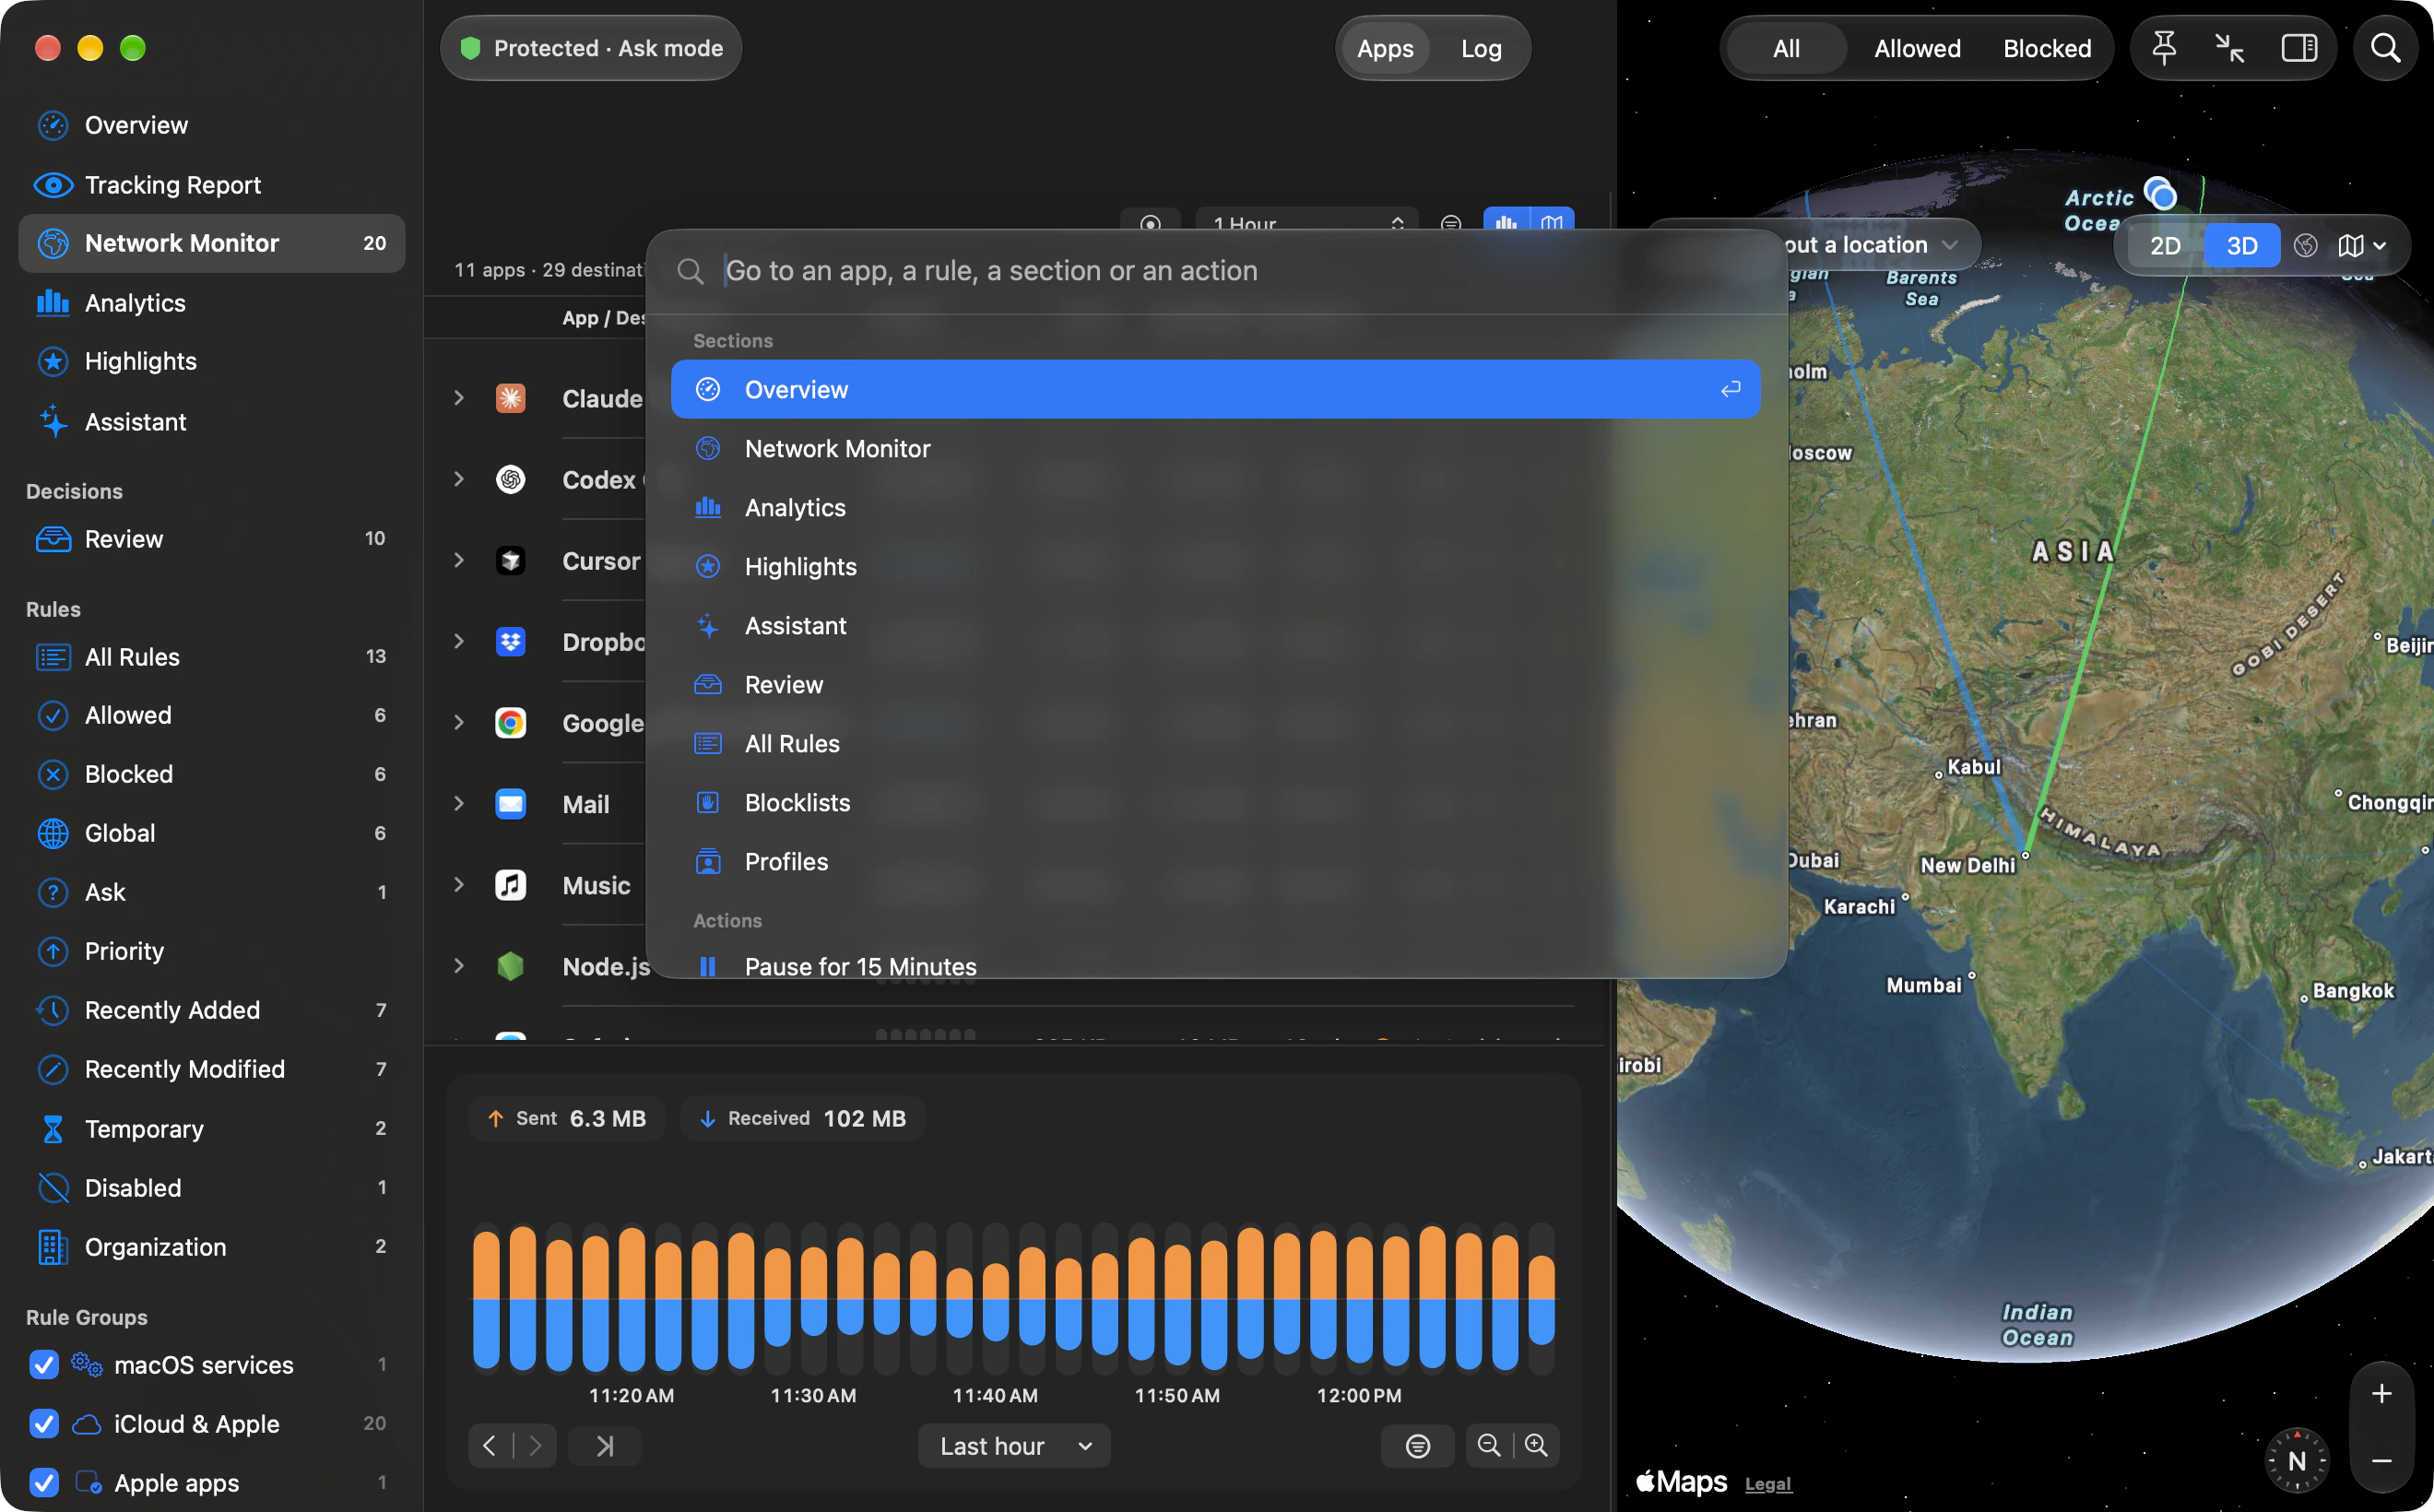
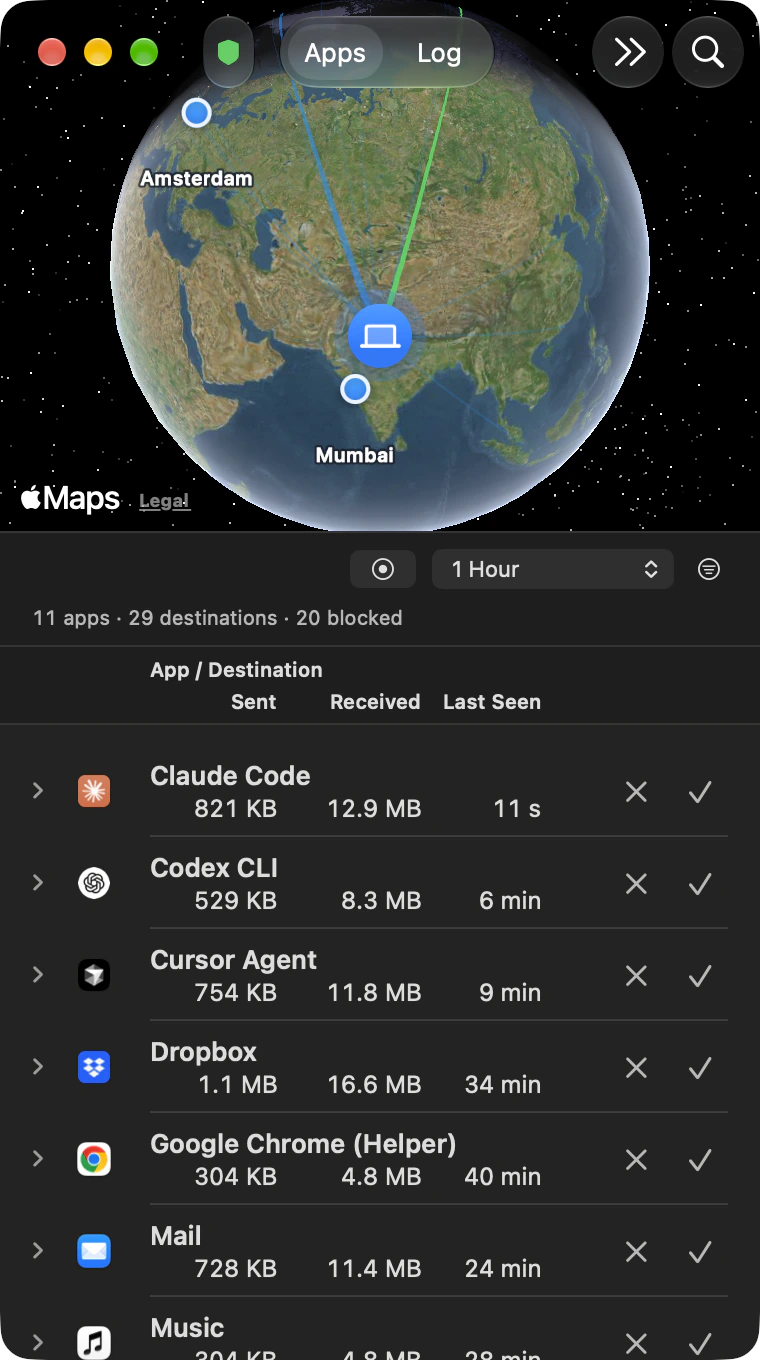
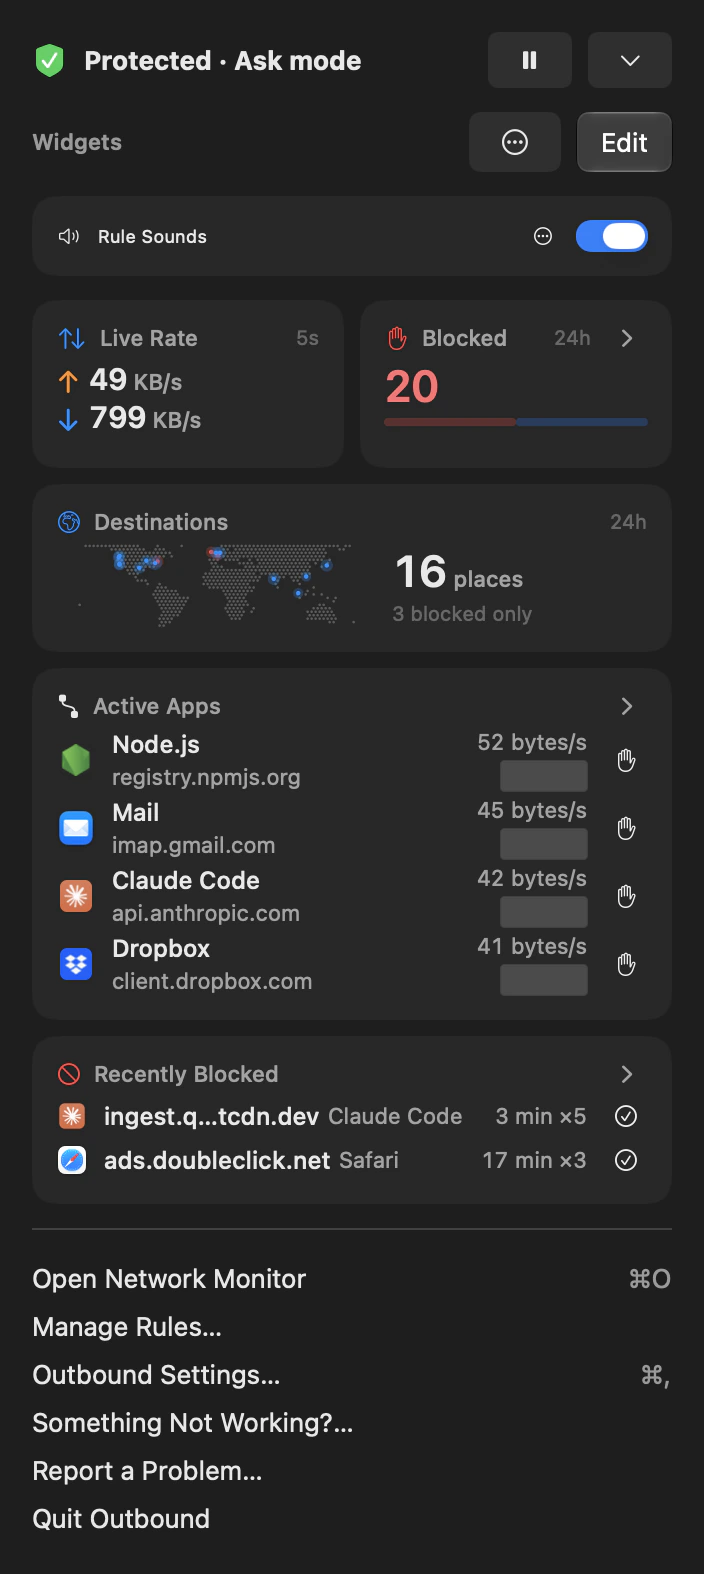
Mini Monitor or the main window
- Right-click Network Monitor in the sidebar and choose Open Mini Monitor, or use Firewall › Mini Monitor. It floats above other windows on macOS 15 and later; on older macOS it is an ordinary window.
- Mini Monitor keeps the connection list and its controls, with the map above it when Show Map is on. It leaves out the traffic chart and the map’s style, zoom and compass controls.
- Record your own Show Network Monitor shortcut in Settings › Monitor. It has no default, opens the main Network Monitor, and works through the background agent while the main window is closed. It is suspended while Settings is open.
Shortcuts and Siri · Use Outbound in your shortcuts.
Five actions run inside Outbound. An action that cannot reach it reports “Outbound is not running.”
- Get Outbound Status
- Read protection, mode and active profile. Is Protecting is false while paused or off.
- Pause Outbound · Resume Outbound
- Pause for 1 to 1440 minutes, with 15 by default, or end the pause. Pausing allows every connection and asks for approval.
- Switch Outbound Profile
- Choose a profile or No Profile. A switch that loosens protection asks for approval.
- Allow or Block an App
- Choose an app file or Bundle Path and Allow or Block its outgoing connections. Allowing asks for approval.
Status, Pause, Resume and Switch Profile are also registered app shortcuts, available to Siri without building a shortcut.
Menu bar
Choose the item. Open the panel.
Settings › Menu Bar controls the item. The background agent keeps its panel available while the main window is closed.
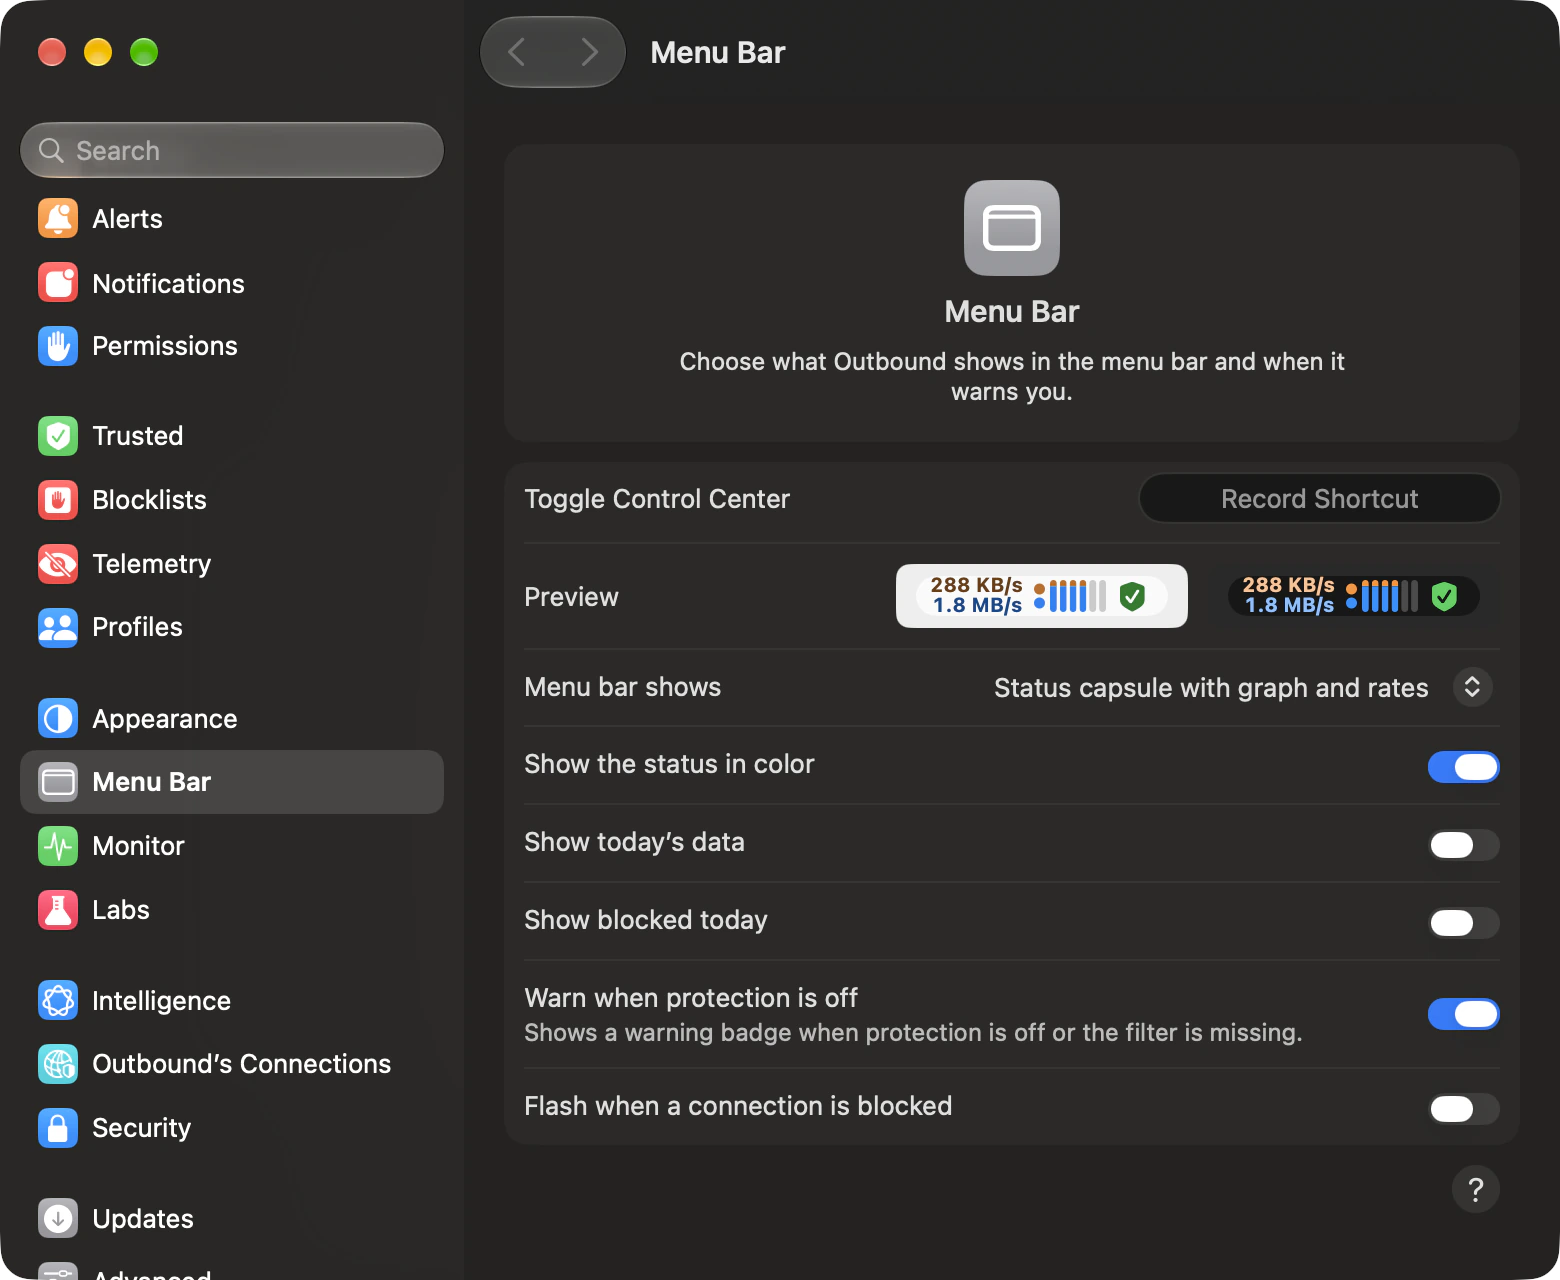
| Style | What stays visible |
|---|---|
| Status capsule with graph and rates | The default: the shield, traffic meter and both rates in a capsule. |
| Icon, graph and upload/download rates | The shield, meter and both rates as separate parts. |
| Icon and traffic graph | The shield and meter, without rate numbers. |
| Icon and traffic history (last 2 minutes) | The shield and a graph of the last two minutes, so a short burst stays in view after the meter goes quiet. |
| Icon only | The shield alone. No meter, rates, TODAY or BLOCKED counters, or live world. |
Counters and warnings
- Show today’s data · Show blocked today
- Both start off. TODAY combines sent and received bytes since midnight; BLOCKED counts destinations blocked today. Both refresh every 15 seconds.
- Show the status in colour
- On by default. Turn it off for the menu bar’s monochrome. Preview shows the item on light and dark backgrounds.
- Warn when protection is off
- On by default. A warning badge appears when the filter is off or missing. Pausing with the filter installed does not show that warning.
- Flash when a connection is blocked
- Off by default. A block flashes the item for 0.6 seconds, with at least one second between flashes.
Inside the panel
- Status, pause, mode and profile: check protection, choose Learn, Ask or Strict, or switch profiles. Pause for 15 Minutes, 1 Hour, 4 Hours, Until the Network Changes or Until Restart; Resume Now ends a pause. A network-change pause needs a current network and ends after four hours at the latest.
- Control Center: a grid of fourteen widgets in three sizes, such as Live Rate, Rate History for the last 5 minutes, Blocked · Last 24 Hours, DNS Encryption, Recently Blocked, Active Apps and a map of the last 24 hours’ destinations. Edit Widgets adds, moves, resizes and removes them.
- Quick answers: Allow in Recently Blocked and Deny in Active Apps make a temporary rule, For 5 minutes or Until logout.
- In its own window: Open as Window keeps Control Center open, with Float on Top. Record a Toggle Control Center shortcut in Settings › Menu Bar.
- Trackers today: once a known tracker is contacted, the line counts trackers and apps. Click it to open the Tracking Report.
Desktop and Notification Center
Two widgets, different views.
Right-click the desktop and choose Edit Widgets, or add a widget in Notification Center.
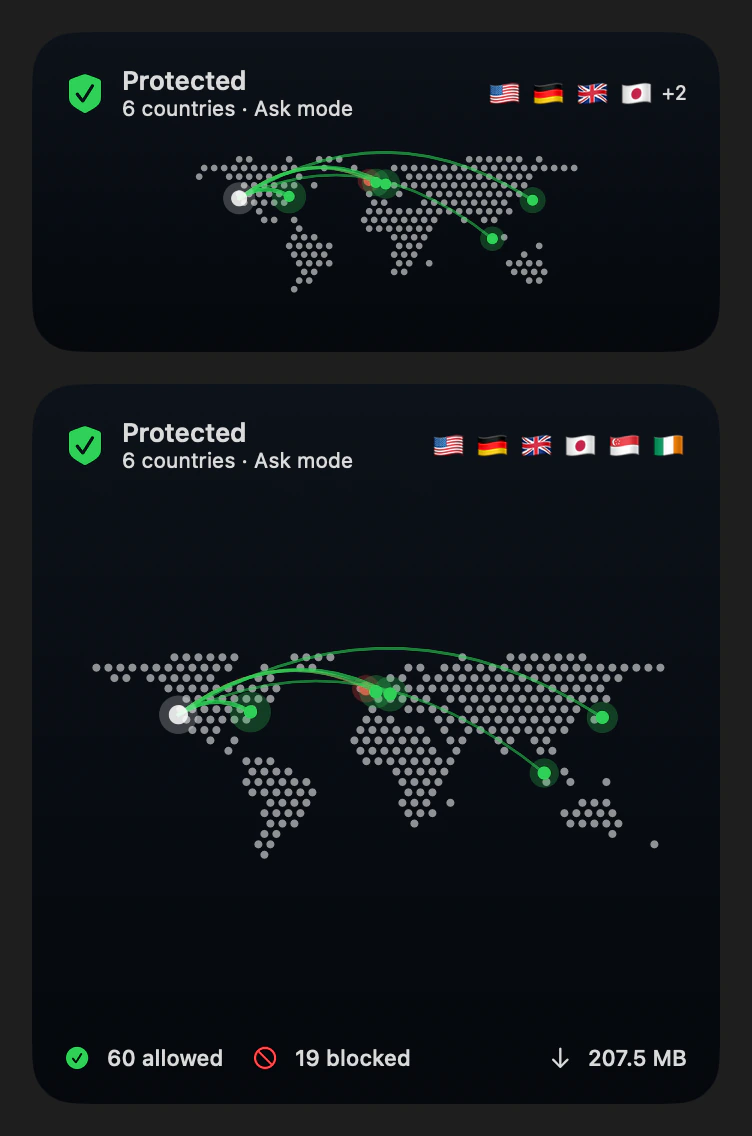
- Outbound
- Small shows protection, mode and connection counts. Medium adds a ring chart, up to three Top Apps and measured traffic totals. Large adds up to four top apps and two Recently Blocked entries.
- Outbound World
- Medium and large show a still dotted map with up to 12 busiest located places from the monitor’s range, protection state and countries. Packets do not animate.
The background agent publishes locally while the main window is closed. Reload requests normally stay at most once a minute. A ten-minute-old snapshot reads Status unknown and Open Outbound to check.
Settings › Notifications
Choose which notices reach you.
Fifteen switches in three groups control notices. macOS must also allow notifications for Outbound.
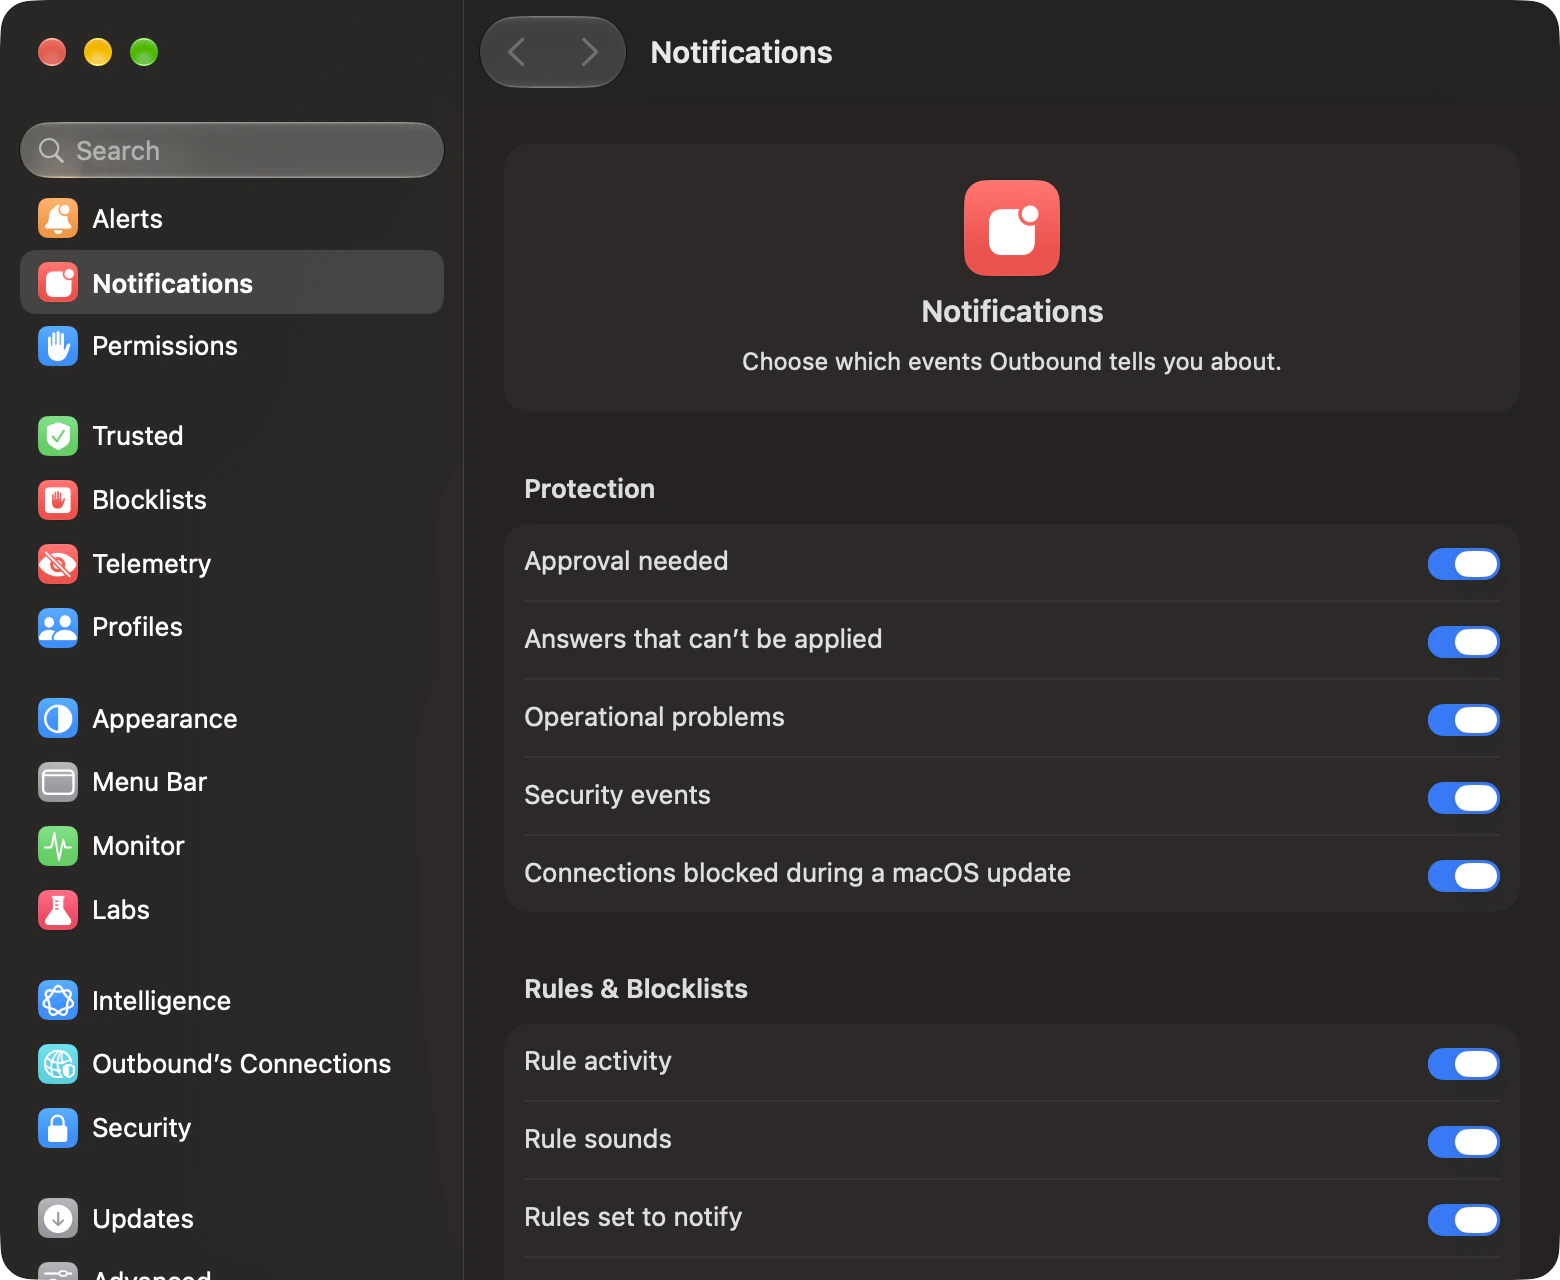
- Protection
- Approval needed, a notice when an answer cannot be applied, Operational problems, Security events, and Connections blocked during a macOS update.
- Rules & Blocklists
- Rule activity, Rules set to notify, Profile changed automatically, Blocklist or rule group updated or failed, and Connections waiting in Review, grouped into at most one notice every ten minutes.
- Activity
- Heavy telemetry at most once a day per app. New countries after a week of learning, up to five a day. New trackers up to three a day, never during a Focus.
- Upload spikes
- Warns when an app uploads more than 50 MB an hour and several times its usual amount: 10×, 5× or 3× for Low, Normal or High. It never blocks, and Expected mutes it for 7 days.
Turning a kind of notice on does not replay events from while it was off. Clicking a notice opens the relevant place in Outbound; an approval still needs Touch ID in the app.
Manual
Related in the manual
Locations
60 MB.
A world that stays on your Mac.
Download the location database from DB-IP. Every lookup happens on your Mac. The live list limit and saved history are separate settings.
Explore locations and saved historyMap and globe
Flat map or 3D globe.
See the places your apps reach. Keep the map in the window, or a globe on your desktop.
Labs
Extras you can switch on.
Live worlds, a notch island and a view on your desktop. Each switches off separately. Protection stays the same.
Around the edges
Smaller windows. Quicker ways in.
A compact window, the menu bar panel, and a palette that goes anywhere. The view you need, close by.
Tech specs
- Open Network Monitor
- ⌘0
- Range
- Live, 10 Minutes, 1 Hour, 5 Hours, 24 Hours, 3 Days, 7 Days, 30 Days, All Kept History
- Show
- All, Allowed, Blocked, Decided by Unapproved Rule, Incoming, Outgoing
- Sort By
- Recent Activity, Name, Data Received, Data Sent, Total Data, Blocked Count
- Group By
- Two levels over App, Domain and Country, in six combinations
- Visible destinations
- 60 per app, then Show All
- Traffic chart span
- 1 minute to 1 year
- Connection Log
- ⌥⌘L
- Float on Top
- ⌥⌘F
- Live connection limit
- 1,000 to 50,000 distinct connections, in steps of 1,000.
- Default live limit
- 5,000 connections
- Keep connection history
- 1 day, 7 days, 30 days, Off
- Default history
- 7 days
- Location download
- 60 MB
Questions about the Network Monitor
Can you see why a connection was blocked?
Select the destination row in the Network Monitor. Why names the deciding rule, including a blocklist, or says the rule has since changed or been removed, that the connection was allowed while Outbound was paused, or what happened when no rule covered it: a once-only answer, a timeout, the alert not being delivered, Outbound not running, Learn or Strict, or that no rule covers it yet.
Does your connection history survive quitting Outbound?
Settings › Monitor lets you keep connection history for 1 day, 7 days or 30 days, including after you quit. Choosing Off deletes saved history and stops recording it.
Do location lookups leave your Mac?
You download the 60 MB location database from DB-IP, then each lookup happens on your Mac.
Does hiding an app stop its rules applying?
No. Hiding stops recording an app’s or a domain’s new connections, and your rules still apply to them. You choose Hide and Keep Listed or Hide and Remove from List for the rows already shown. Deleting what was already saved is a separate step: Delete Saved History for the app, destination or domain. Choose Show Again under Settings › Monitor › Hidden Connections to resume recording. Show Again stays disabled while settings are locked.
Can you see connections in the order they happened?
Yes. Switch the Network Monitor to Connection Log (⌥⌘L) for a dated list of each connection, newest first. Filter it by app, host, country, continent, owner or rule, pause it to read, or follow one app.

Choose where your apps connect.
Outbound is $29 for the first 50 licences, then $39. Either way, you pay once.
- 2 Macs, or 5 with Family
- One-time, no subscription
- Full refund within 14 days
- macOS 14 or later