
Network Monitor
The live connection list: ranges, filters, sorting and grouping, connection types, focus, row actions, the map and history.
The Network Monitor is the live list of connections, with the traffic chart and the map. Open it with Firewall › Network Monitor (⌘0), the sidebar, or the Show Network Monitor shortcut. The Apps and Log switch at the top of the window changes between this list and the Connection Log.
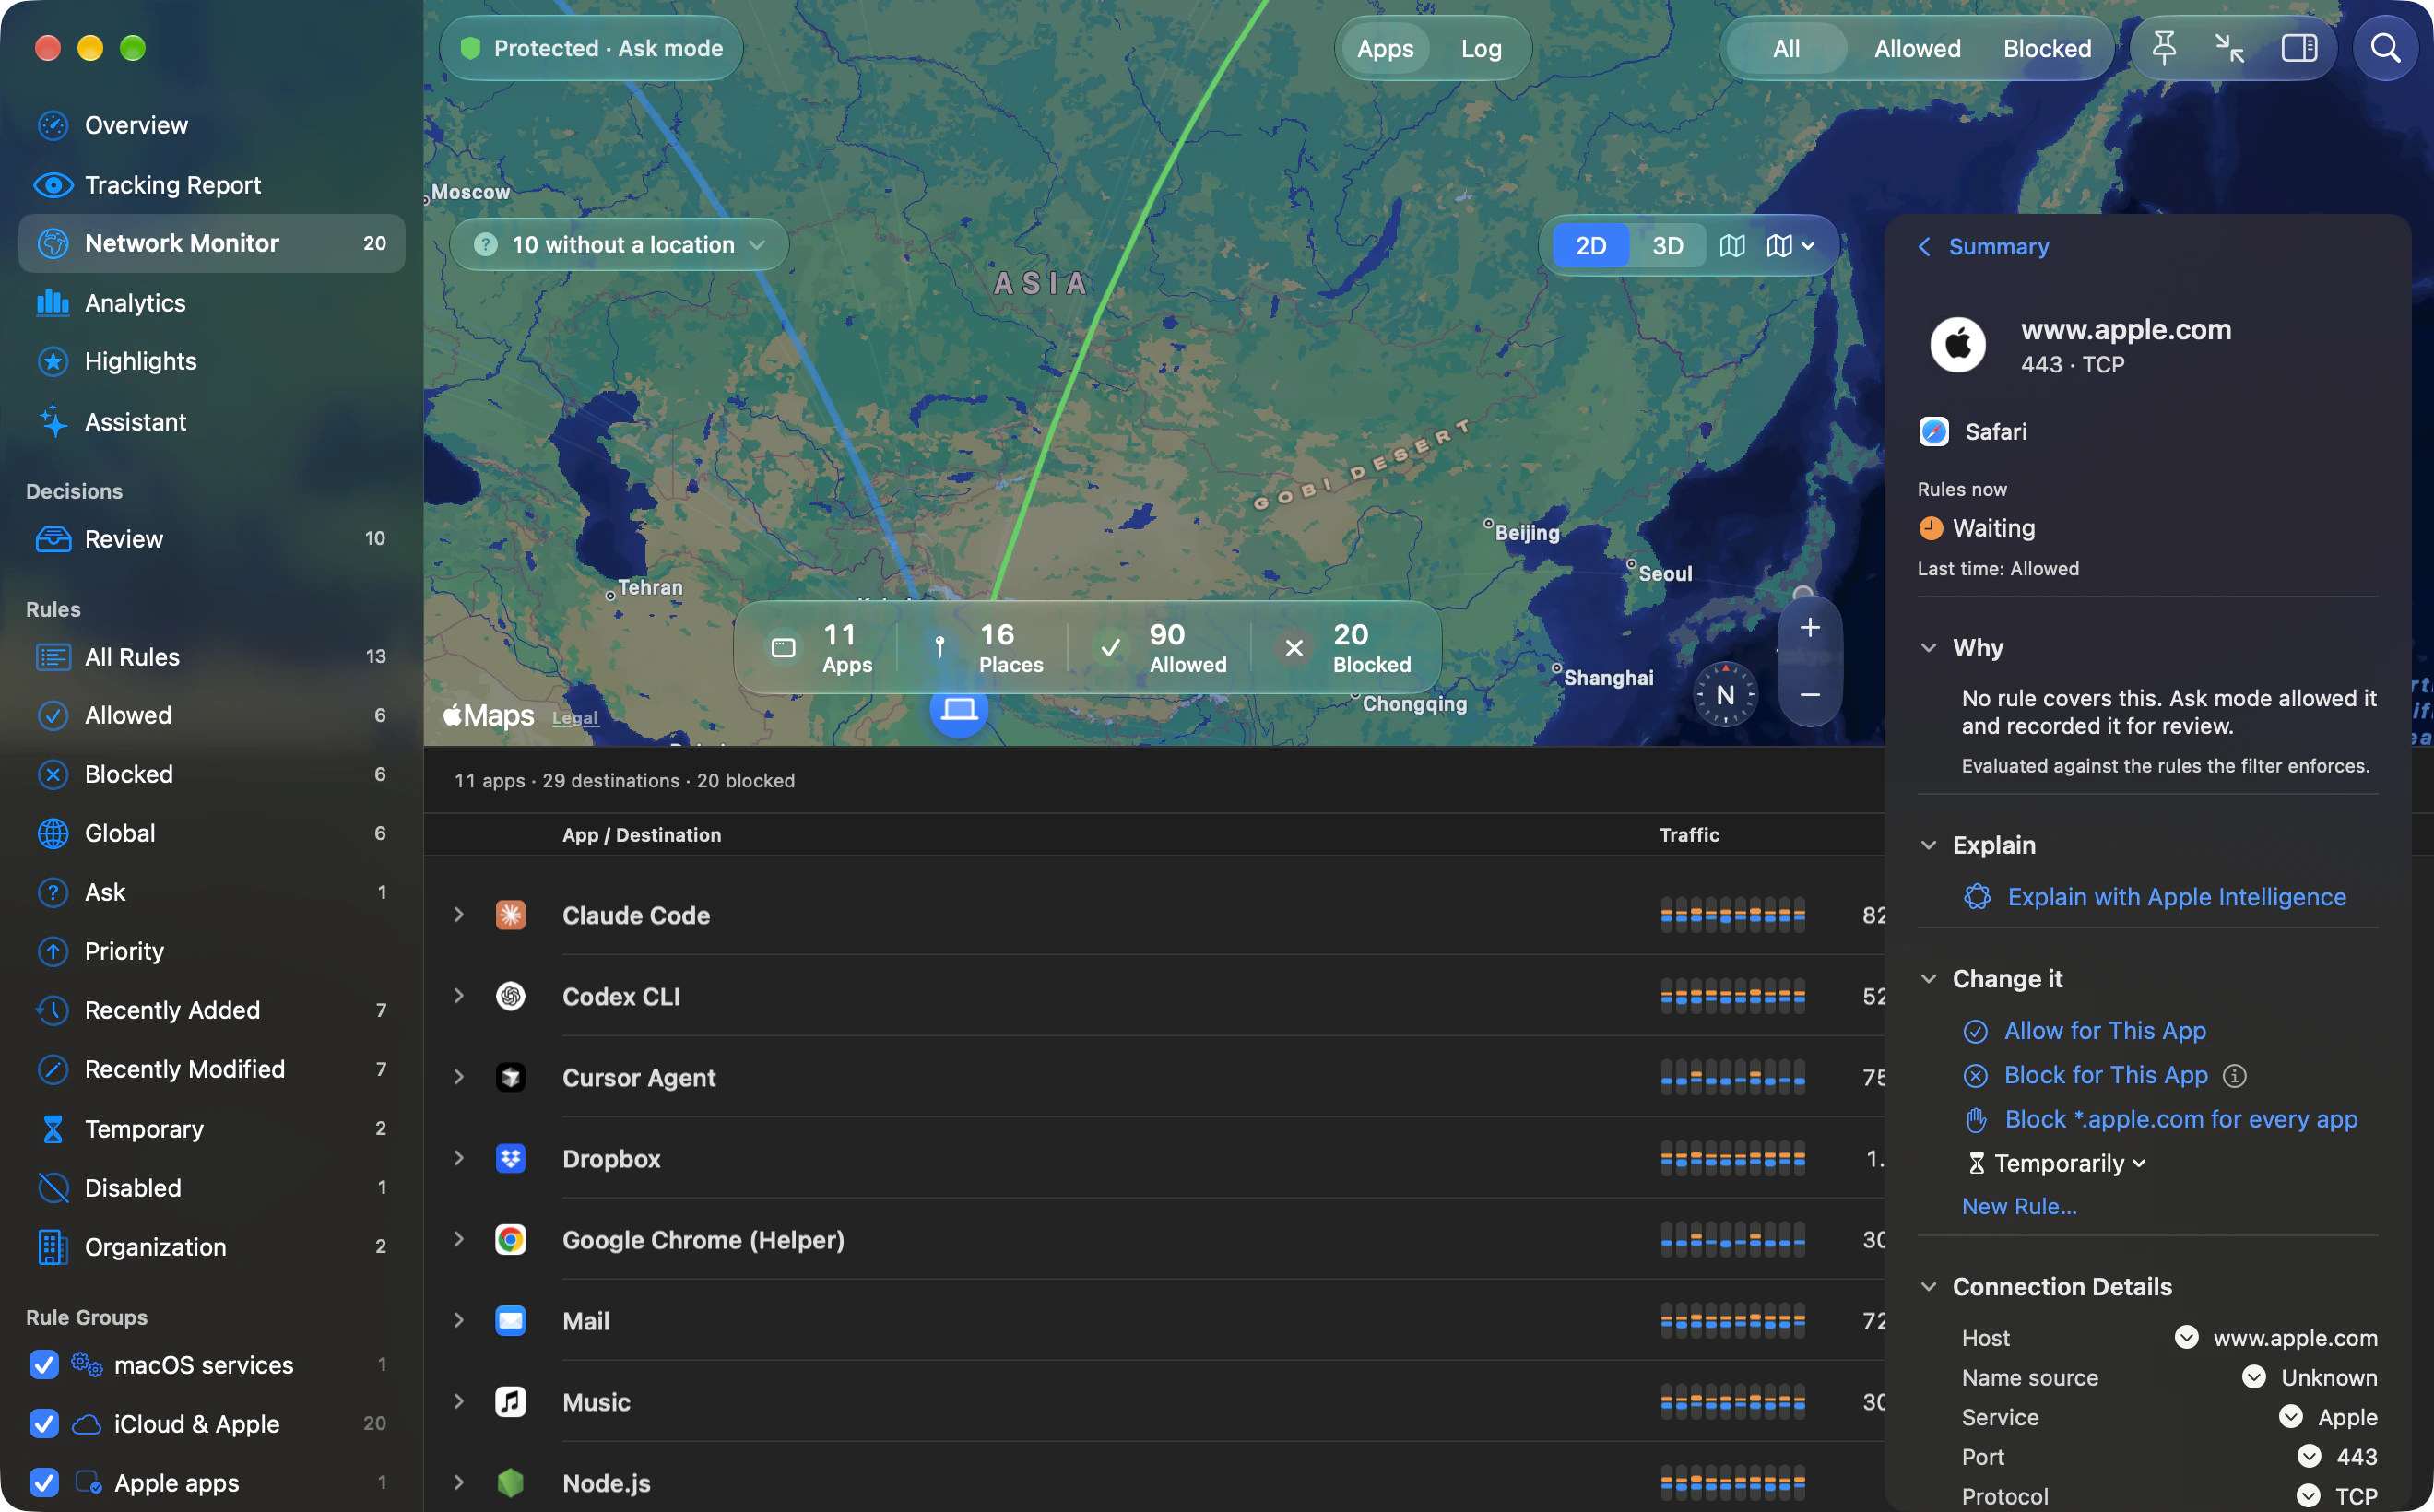
The controls
Section titled “The controls”Left to right:
- All, Allowed or Blocked, and a filter menu beside them. The menu adds Decided by Unapproved Rule, Incoming and Outgoing, and shows how many connections each choice holds. All is the default.
- Range: Live, 10 Minutes, 1 Hour (the default), 5 Hours, 24 Hours, 3 Days, 7 Days, 30 Days and All Kept History. 30 Days is offered only when Keep connection history is 30 days, and All Kept History only while history is kept at all.
- The sort menu, labelled Sort By for accessibility. It also holds Group By and Show Apple Services Without Data.
- The connection types menu, labelled Connection Types. Its symbol fills in while any type is hidden. See Connection types.
- From Now (⌘K). Off, its help is “Show only connections from this moment (⌘K)”. On, its help is “Show the whole range again (⌘K)”.
- Search, prompt “Search apps and places”, with the field syntax and smart filters.
- Traffic chart and Map, hidden in the compact window. View › Show Map (⌥⌘M) and View › Show Traffic Chart (⌥⌘C) are the same switches. Both start on.
When the pane is narrow (under 860 points), the map is showing, or the window is compact, search and the view switches drop to a second row. In the compact window, All, Allowed and Blocked fold into the filter menu.
The map sits beside the list when the pane is wide enough for both, and above the list when it is not. In the compact window it is always above, when the map is on. The chart is hidden in the compact window. When the map is above the list, the chart appears only if the pane is at least 860 points tall.
The View menu repeats these controls: Sort By, Group By (⌥⌘1 to ⌥⌘6), Time Range (⌃⌥⌘1 to ⌃⌥⌘9), Show Connection Log (⌥⌘L), Float Network Monitor on Top (⌥⌘F) and one switch for each connection type.
Float on Top
Section titled “Float on Top”Float on Top keeps the Network Monitor above your other windows, so you can watch it while you work in another app. Use the pin in the window or View › Float Network Monitor on Top (⌥⌘F). It applies while the window shows the Network Monitor and is not full screen, and it steps aside while another Outbound window, such as Settings, is in front. Choose it again to let the window go back behind others.
Sorting and quiet Apple services
Section titled “Sorting and quiet Apple services”The sort menu offers Recent Activity (the default), Name, Data Received, Data Sent, Total Data and Blocked Count. Recent Activity lifts whatever is moving data now.
Show Apple Services Without Data is off by default. With it off, Apple-signed apps that moved no bytes and have no blocks are left out of the list. Third-party apps stay. The quiet Apple apps also stay when there is no traffic sampler, or when the search contains a tracker: term.
Grouping
Section titled “Grouping”Group By always has two levels. The first level is the row you open; the second is what it holds.
| Group By | Rows | Inside each row |
|---|---|---|
| App → Domain (the default) | Apps | Their destinations |
| App → Country | Apps | The countries they reached |
| Domain → App | Domains | The apps that reached them |
| Domain → Country | Domains | Their countries |
| Country → App | Countries | The apps that reached each one |
| Country → Domain | Countries | The domains in each one |
Country → App answers “who reaches this place”. A destination without a known country is grouped under Unknown/Private. Outbound remembers the grouping you chose.
The list
Section titled “The list”With the default grouping, rows are apps. Expanding an app shows destinations. Two or more hosts under one registrable domain fold into one domain row. An app shows its first 60 destinations, then Show All N for the rest and Show Fewer to fold them back.
Each app row shows:
- A traffic meter, help “Recent traffic: sent above, received below”. It has 10 slots when the column is full width and 7 when it is narrower.
- Sent and Received.
- Last Seen.
Small dots beside a name light up while that row is moving data or being blocked. Rows are not tinted.
A destination shows its exact Sent and Received bytes once the filter has measured at least one of its connections closing. Until then its two columns show allowed and blocked counts, green for allowed and red for blocked when the count is above zero. A folded domain adds up its hosts’ bytes. When only some of its hosts have been measured, the total is marked “≥”, and VoiceOver reads it as “at least”.
As the list narrows, the name truncates first and stops at 120 points. Then the meter steps aside, Sent and Received stack into one column, and Last Seen is the last to go. Point at a shortened name to read it in full.
Connection types
Section titled “Connection types”Five kinds of connection can be left out of the list, the chart, the map and the counts. Each has its own switch in the connection types menu and in the View menu, and all five start on:
- Show Loopback Connections (127.0.0.1, ::1): connections from this Mac to itself.
- Show Local Network Connections: addresses on your local network, including the ranges you add in Advanced settings.
- Show Network Extension Connections: traffic from VPN apps and other network helpers.
- Show Connections Without a Process: connections the filter could not tie to an app.
- Show Connections of Other Users: connections made by another account on this Mac.
A connection is hidden only when Outbound has evidence that it belongs to that kind. Turning a type off changes the view, not your rules.
Right-click an app, a destination or a country and choose Focus on NAME to narrow the whole monitor to it. A chip reading “Focused on NAME” stays at the top of the list. Click the chip, or press Escape, to return to the view you had before. Filter in the same menu narrows the search instead.
When the list is empty
Section titled “When the list is empty”With nothing recorded in the range, the list says No Connections in This Range and “No events in the last hour. Try a longer range.” (the phrase follows the range).
When search, a filter, a hidden connection type, Focus or From Now hides every row, it says No Matches, then one line for each restriction in force, such as “Loopback connections are hidden”. Clear Active Restrictions removes them all at once and shows the connections again.
The verdict switch
Section titled “The verdict switch”App rows carry a switch. Its help names the rules in force (“Rules now: VERDICT.”), the previous decision (“Last time: TITLE.”), and says turning it off blocks all internet for the app, with a right-click for Ask and Use Inherited Rule. The decisions are rules. Inspect them in the rule manager.
Selecting several rows
Section titled “Selecting several rows”Command-click or Shift-click to select several apps or destinations. The Connection menu then acts on the whole selection: Allow, Deny, Inspect (⌘I), Show Rule, Show in Blocklist, Approve Rules for Selection and Reset Counters for Selection. Its Copy submenu copies Names, Process Names, Paths, Hostnames, Domains or IP Addresses, one per line. With one row selected the same items read in the singular. An item that does not apply to the selection is dimmed, and its help says why.
Right-click actions
Section titled “Right-click actions”Right-click an app for Allow, Block, Ask Each Time and Use Inherited Rule. The current choice is ticked. Then Inspect, Show Matching Rules, Show in Map, Show in Finder, Telemetry… when Outbound knows something about that app’s trackers, the selection actions above, and Copy App Name. The menu ends with Remove from List, Delete Saved History for APP… and Hide Connections from APP…. See Hidden connections.
Right-click a destination for the same four verdicts, then Inspect, Show Matching Rule, Show in Map, Show in Tracker Database when the destination is a known tracker company, and copy items for its host, IP address, domain, app name, port and country. It ends with Remove from List, Delete Saved History for DESTINATION… and Hide Connections to DOMAIN… for a host.
Right-click a folded domain for the four verdicts, Inspect, Show in Map, Show Matching Rule, Copy Domain, Remove from List, Delete Saved History for DOMAIN… and Hide Connections to DOMAIN….
Remove from List takes the rows off the list now, with Undo. New connections still appear. It deletes nothing that was saved.
Deleting saved history
Section titled “Deleting saved history”Delete Saved History for NAME… asks first. The alert reads: “Saved connection events for NAME will be permanently erased. This cannot be undone. New connections will still be recorded; your rules and statistics stay in place.” Choose Delete Saved History to go ahead.
For an app it erases that app’s saved events, for a destination that app’s events to that host, and for a domain every app’s events to that domain. It is separate from hiding: hiding stops new records, and deleting removes old ones. From Terminal, outboundctl history delete with --app, --host or --domain does the same, and it never deletes every app’s history at once.
History
Section titled “History”Settings › Monitor sets how many connections the live list keeps: Remember N connections, from 1,000 to 50,000 in steps of 1,000. The default is 5,000.
Keep connection history on the same page is 1 day, 7 days (the default), 30 days or Off. Off deletes the saved history and stops recording. Saved history is what the longer ranges, the Connection Log and the traffic chart read after you quit and reopen Outbound.